

USDT and USDC transfer volumes declined 21% and 13% week-over-week respectively, while USD1 rose 67% to $104.9 million daily and RLUSD grew 19%. Supply dynamics show a net $1.1 billion contraction across the market, with USDT accounting for $930 million in redemptions. The data points to a broad redistribution of transfer activity rather than overall market withdrawal.
Market overview
Total stablecoin market capitalization stood at $289.5 billion as of February 23, 2026, across 17 analyzed assets. USDT and USDC together account for $258.1 billion, or 89% of total market value. Daily transfer volume across all assets reached $6.1 billion.
The week was defined by a clear split in transfer momentum. The two largest stablecoins – USDT and USDC – recorded week-over-week transfer declines of 20.7% and 13.0% respectively. At the same time, several mid-tier and smaller assets posted strong gains. USD1 transfers rose 67.2% to $104.9 million daily. RLUSD increased 19.0% to $22.9 million. DAI added 5.9%.
On the other end, two assets saw sharp drops. FDUSD transfer activity fell 93.1% from $10.1 million to $693,700 daily. CRVUSD declined 91.6% from $35.3 million to $3.0 million. These concentrated declines suggest specific catalysts rather than broad market weakness.
Stablecoin transfer and supply snapshot
| Asset | Market cap | WoW transfer | Daily avg | Supply trend |
| USDT | $183.6B | -20.7% | $4.37B | Contraction (-$930M) |
| USDC | $74.5B | -13.0% | $1.29B | Expansion (+$365M) |
| USD1 | $5.0B | +67.2% | $104.9M | Contraction (-$173M) |
| DAI | $4.4B | +5.9% | $52.2M | Expansion (+$25M) |
| PYUSD | $4.1B | -5.2% | $25.8M | Contraction (-$42M) |
| XAUT | $2.7B | -31.7% | $41.0M | Stable |
| PAXG | $2.4B | -52.0% | $18.6M | Contraction (-$33K) |
| RLUSD | $1.6B | +19.0% | $22.9M | Expansion (+$37M) |
| USDTB | $890.6M | -61.9% | $5.7M | Expansion (+$559K) |
| USDAI | $475.8M | +451.2% | $27.9M | Contraction (-$90M) |
| FDUSD | $394.3M | -93.1% | $693.7K | Contraction (-$820K) |
| CRVUSD | $276.3M | -91.6% | $3.0M | Contraction (-$85K) |
Source: Crystal Foresight. Data as of February 23, 2026. WoW = week-over-week.
Transfer momentum: a two-speed market
The transfer data reveals a clear two-speed dynamic. Among the 12 largest assets by market cap, seven recorded negative week-over-week transfer changes. The declines were concentrated in both large-cap leaders and smaller specialized assets.
USDT daily transfers fell from $5.51 billion to $4.37 billion, a decline of $1.14 billion per day. USDC dropped from $1.49 billion to $1.29 billion. These are significant absolute reductions, though both assets retain dominant market share by volume.
USDAI recorded the largest percentage gain at 451%, with daily transfers rising from $5.1 million to $27.9 million. This increase, while notable in percentage terms, represents a small absolute figure relative to total market volume. The asset also saw $90 million in supply contraction, which may indicate concentrated trading activity among a limited number of participants rather than broad-based adoption.
USD1 presents a more substantial case. Its 67.2% transfer increase brought daily volumes to $104.9 million against a $5.0 billion market cap. However, the asset simultaneously shed $173 million in net supply, creating a divergence between rising transfer activity and declining supply that bears monitoring.
Market cap: two-week percentage change
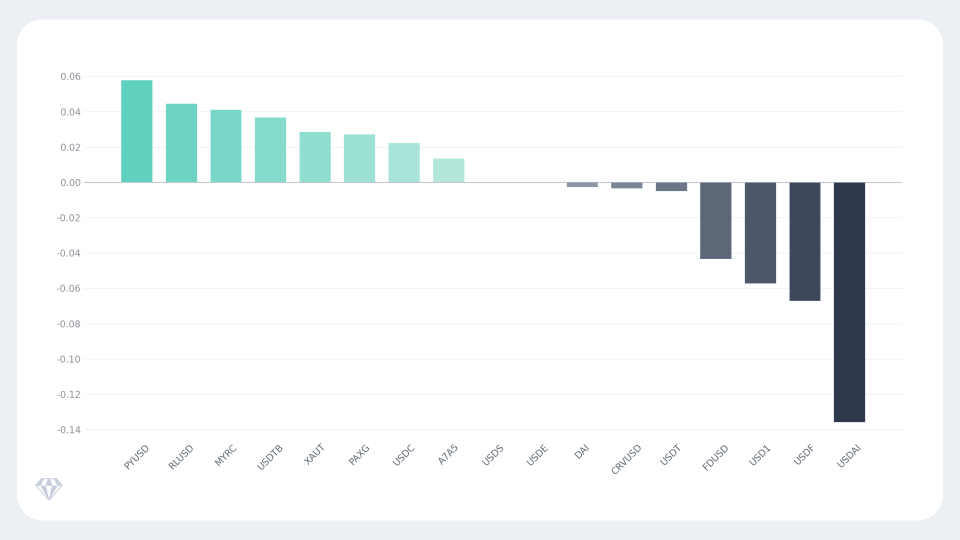
Market Cap % 2 week change by asset – February 13, 2026
Market capitalization changes over the two-week period show a split. PYUSD led gains at +5.8%, followed by RLUSD (+4.4%), MYRC (+4.1%), and USDTB (+3.7%). Gold-backed tokens XAUT (+2.9%) and PAXG (+2.7%) also gained, likely reflecting commodity price movements. On the negative side, USDAI lost 13.6% of its market cap, USDF fell 6.7%, and USD1 declined 5.7%. USDT, the market leader, saw a modest 0.5% decline.
Supply dynamics: net contraction of $1.1 billion
The market recorded a net supply contraction of approximately $1.1 billion for the week. USDT led redemptions with $930 million in net burns. USD1 contracted by $173 million and USDE by $149 million.
On the expansion side, USDC added $365 million in net supply, followed by USDS at $97 million and RLUSD at $37 million. USDC supply expansion alongside declining transfer activity suggests institutional accumulation – large holders adding to positions while daily trading activity cools.
The USDT contraction is the largest weekly supply reduction among all assets analyzed. Combined with a 20.7% drop in transfer activity, it signals reduced demand across both retail and institutional segments for the market leader this week.
Concentration and velocity
USDT remains the most distributed stablecoin. Its top-10 holder concentration stands at 27.4%, with 37,480 addresses holding 80% of supply. USDC follows at 29.4%. By contrast, newer assets show high concentration: USDAI at 95.6%, PYUSD at 92.3%, and USD1 at 89.4%.
Velocity data highlights specialized use patterns. MYRC recorded a daily velocity of 29.4%, meaning nearly a third of its supply changes hands each day. This extreme turnover, combined with a 207% transfer growth, suggests algorithmic or programmatic trading rather than organic transactional use. USDT velocity stood at 1.8% and CRVUSD at 1.6%.
Risks and signals to watch
Liquidity concentration risk FDUSD and CRVUSD both experienced transfer declines above 90% in a single week. Such sharp drops may indicate liquidity withdrawal, and could affect peg stability if outflows continue. These assets require close monitoring in the coming weeks.
Momentum sustainability
The large percentage gains in alternative stablecoins – particularly USDAI and MYRC – occurred from low absolute bases. High percentage growth from small volumes can reverse quickly. The combination of rising transfers and contracting supply in USDAI and USD1 deserves particular attention, as it may indicate speculative activity rather than sustained adoption.
Market leader deceleration
Both USDT and USDC showing simultaneous transfer declines while maintaining stable market caps suggests a broad reduction in trading activity rather than competitive displacement. If this pattern continues, it could indicate a broader slowdown in crypto market activity.
Key takeaways
- USDT and USDC transfer volumes declined 20.7% and 13.0% week-over-week, though both assets maintain dominant market positions at $183.6 billion and $74.5 billion respectively.
- USD1 transfer activity rose 67.2% to $104.9 million daily while its supply contracted by $173 million – a divergence that warrants monitoring.
- The market recorded $1.1 billion in net supply contraction, led by $930 million in USDT redemptions. USDC partially offset this with $365 million in net expansion.
- FDUSD (-93.1%) and CRVUSD (-91.6%) recorded sharp transfer declines, creating potential liquidity concentration risk for both assets.
- Market cap trends over two weeks show a split: PYUSD, RLUSD, and commodity-backed tokens gained, while USDAI, USDF, and USD1 declined.