
Key takeaways
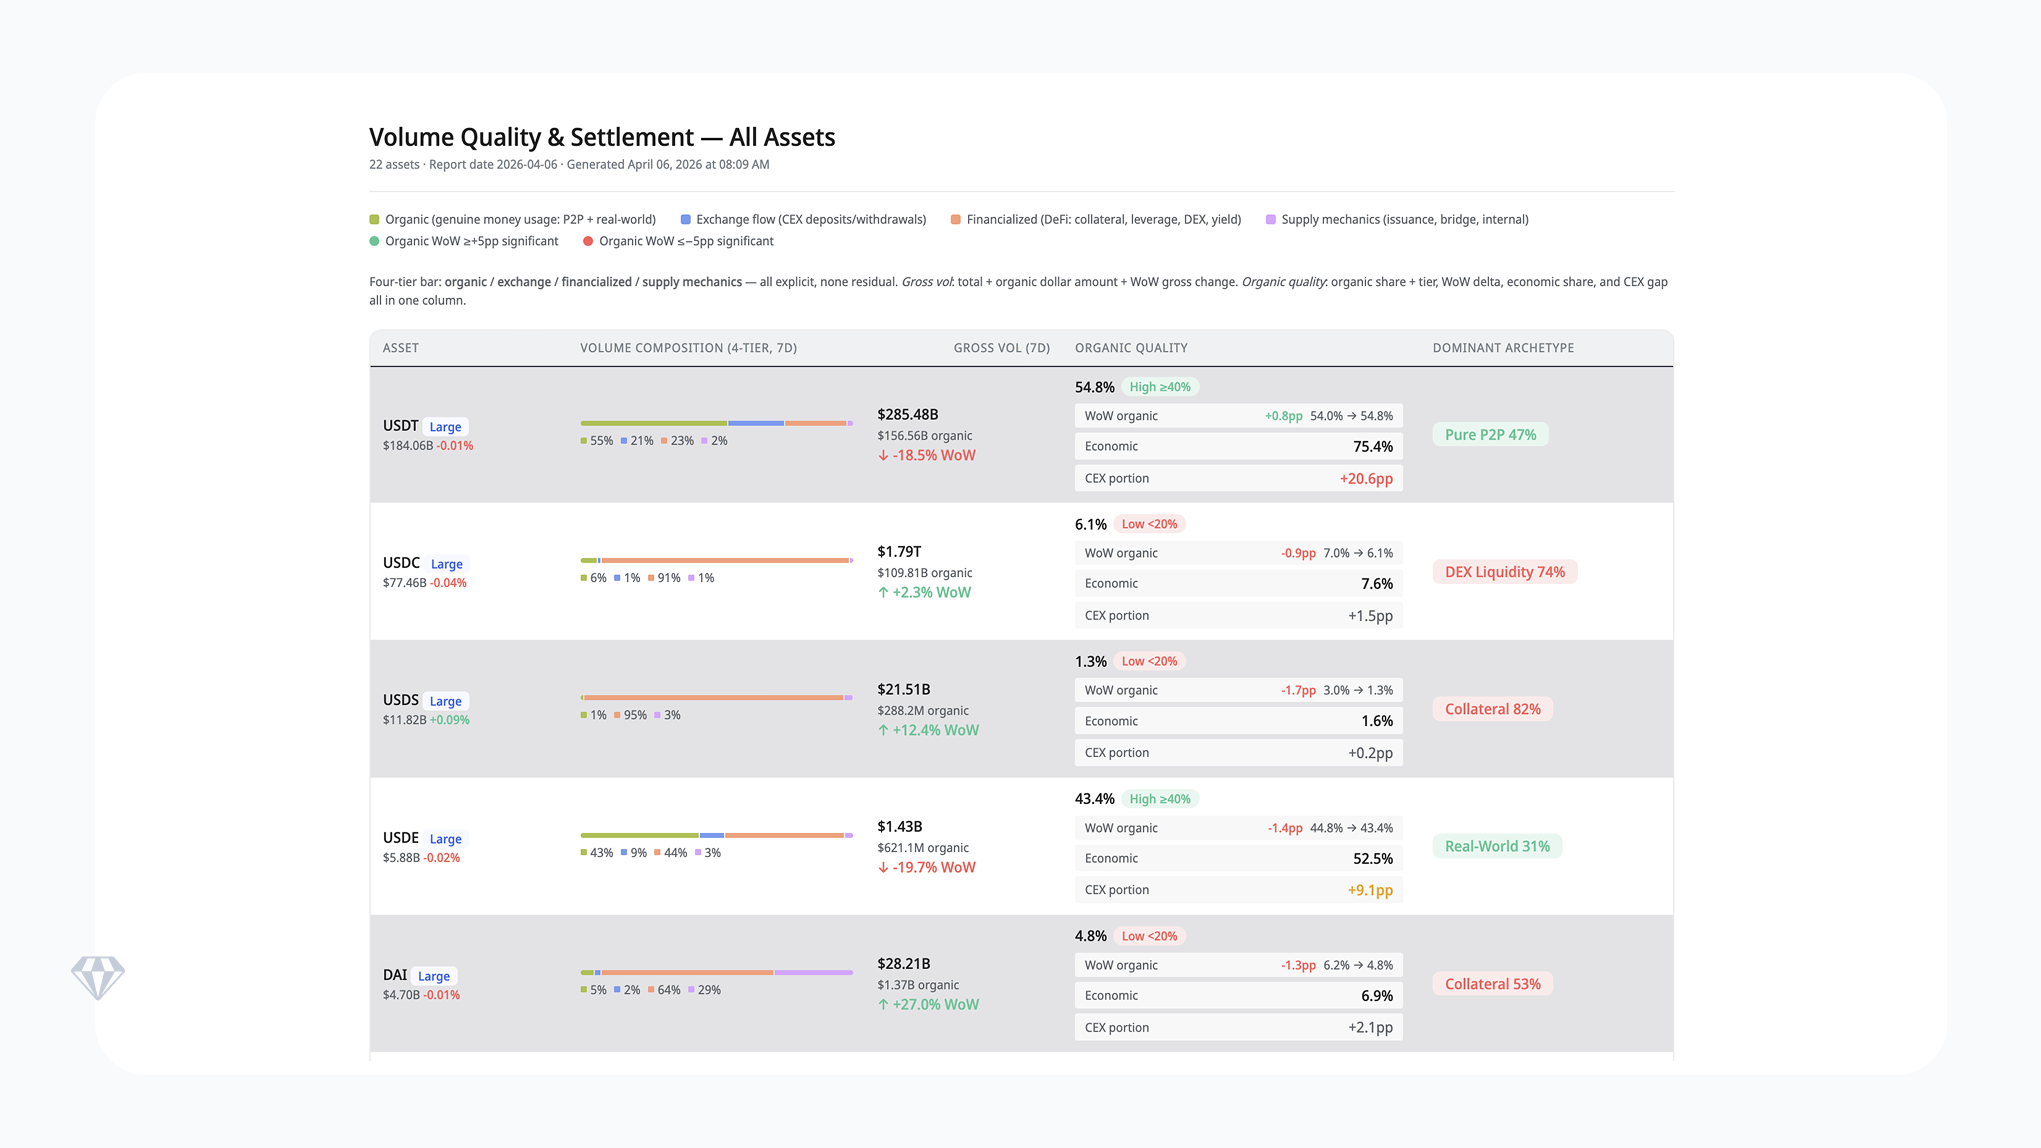
- Only $565B of $2.14T total gross volume (26.4%) represented genuine money movement. USDC processed $1.79T in gross volume but delivered just $109.8B in authentic usage. USDT maintained settlement leadership with $156.6B in genuine transfers.
- Ten assets posted organic share swings exceeding 5 percentage points, with RLUSD falling 13.5pp to 36.9%, CRVUSD dropping 13.7pp to 24.7%, and PYUSD declining 7.4pp to 18.6%. This breadth of volatility is unusual and suggests structural shifts in how these assets are used.
- USDS expanded supply by $426.7M while maintaining only 1.3% organic share. Of $21.5B in gross volume, just $288.2M reflects genuine user activity. The gap between supply growth and settlement utility raises questions about what is driving circulation expansion. The majority of USDS volume goes to the sUSDS contract where users hold funds to generate yield.
Market overview: 27 assets, $301.4B total cap
Crystal Foresight tracked 27 stablecoin and tokenised assets this week with a combined market capitalisation of $301.4B. USDT holds 61.1% market share. USDC holds 25.7%. The remaining 25 assets share 13.2%.
The table below summarises settlement quality and supply dynamics for the 13 largest assets. Organic share measures the portion of gross transfer volume that represents genuine money movement – peer-to-peer payments and real-world settlement – rather than DeFi protocol mechanics, exchange routing, or supply management operations.
Three patterns stand out.
- First, seven of the 12 assets with declining organic share also posted rising gross volume, confirming that headline growth is coming from DeFi mechanics rather than payment adoption.
- Second, USDT is the only large-cap asset maintaining organic share above 50%.
- Third, the mid-cap tier (A7A5, USDF, USDTB) contains all the assets with organic share above 46%.
Settlement quality: who improved, who declined
The stablecoin market uses gross transfer volume as its primary activity metric. This number conflates genuine money movement with DeFi collateral cycling, DEX liquidity provision, leverage mechanics, and issuer supply operations. Crystal Foresight separates these components to surface what we call organic share – the portion of volume that represents actual value transfer between real users.
This matters for three reasons. Issuers use gross volume to signal adoption. Institutions use it to assess liquidity depth. Regulators use it to gauge systemic importance. If the majority of reported volume is protocol mechanics rather than genuine payments, all three groups are making decisions on distorted data.
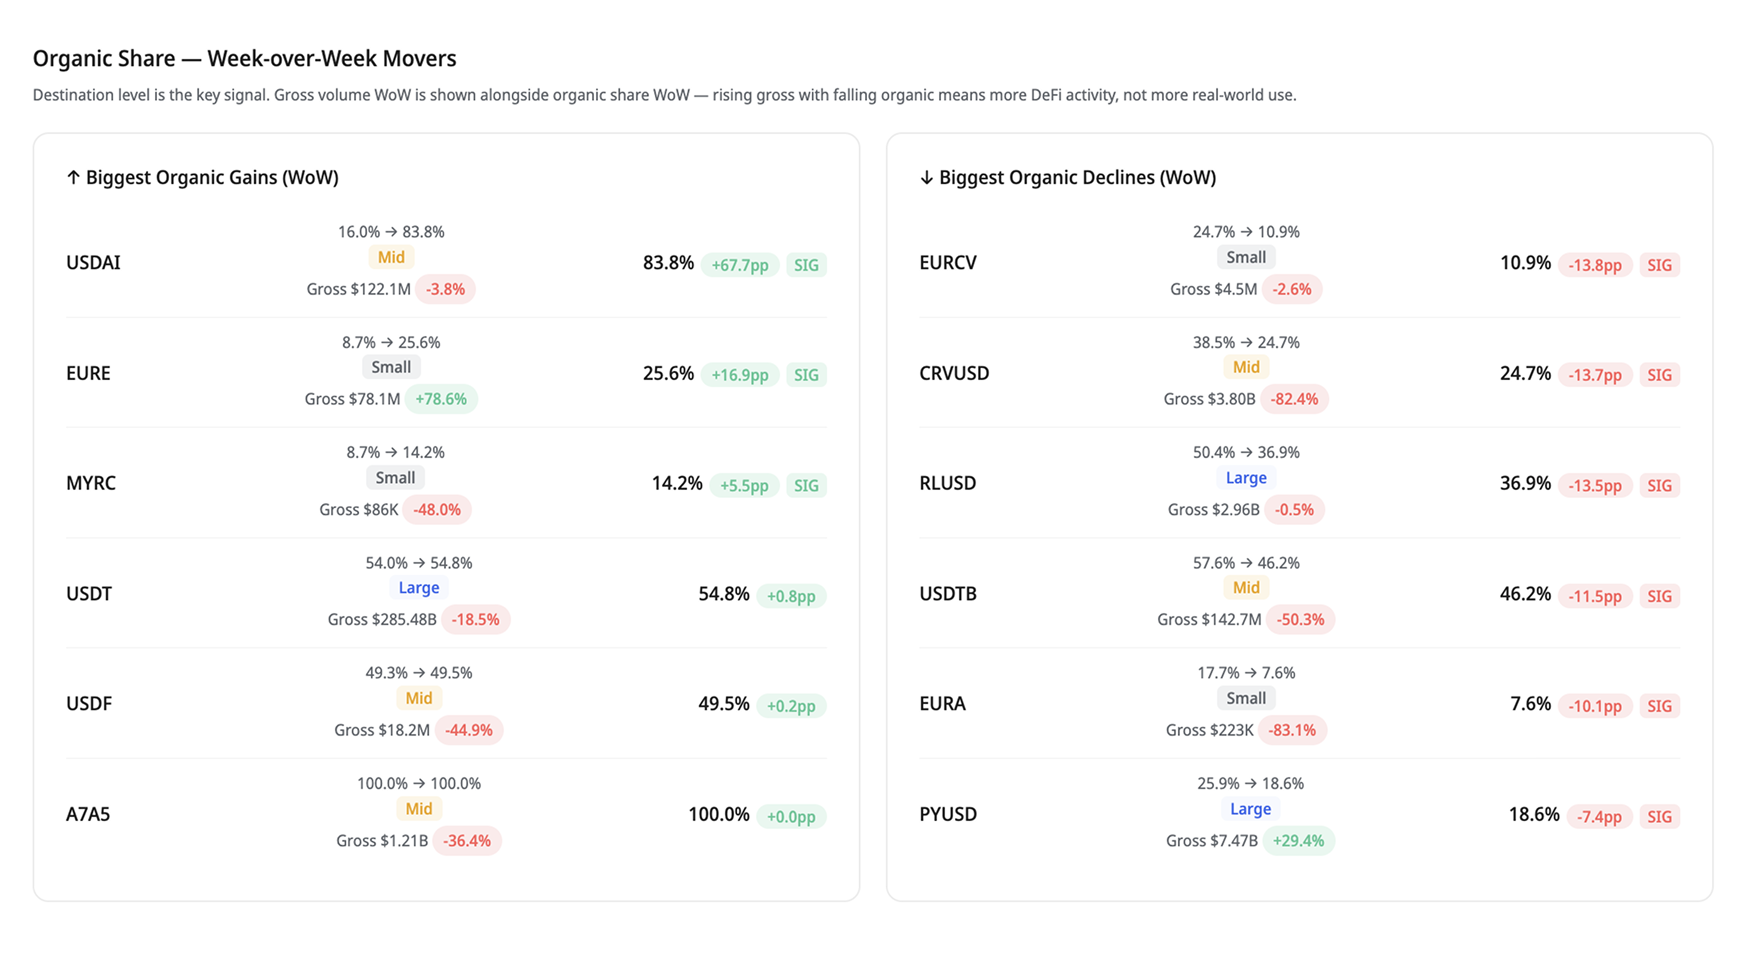
EURE rose from 8.7% to 25.6% organic share alongside a 78.6% gross volume increase. MYRC improved from 8.7% to 14.2%, though on very small absolute volume ($86K gross). A7A5 held steady at 100% organic share at $1.2B gross, confirming that its payment-only architecture consistently excludes DeFi mechanics from its volume profile.
RLUSD fell from 50.4% to 36.9% organic share, a 13.5pp decline. Gross volume was essentially flat (-0.5%), which means the quality deterioration came from a shift in volume composition – more exchange routing, less direct payment. For a large-cap asset that had been building a settlement quality story, this is a reversal worth monitoring.
CRVUSD dropped 13.7pp to 24.7% while gross volume collapsed 82.4%. USDTB fell 11.5pp to 46.2% with gross volume halving. PYUSD declined 7.4pp to 18.6% despite a 29.4% gross volume increase – a clear case of headline inflation through DeFi mechanics rather than payment growth. PAXG shed 6.2pp to 29.9% as precious metals transfer activity cooled following the prior week’s volatility.
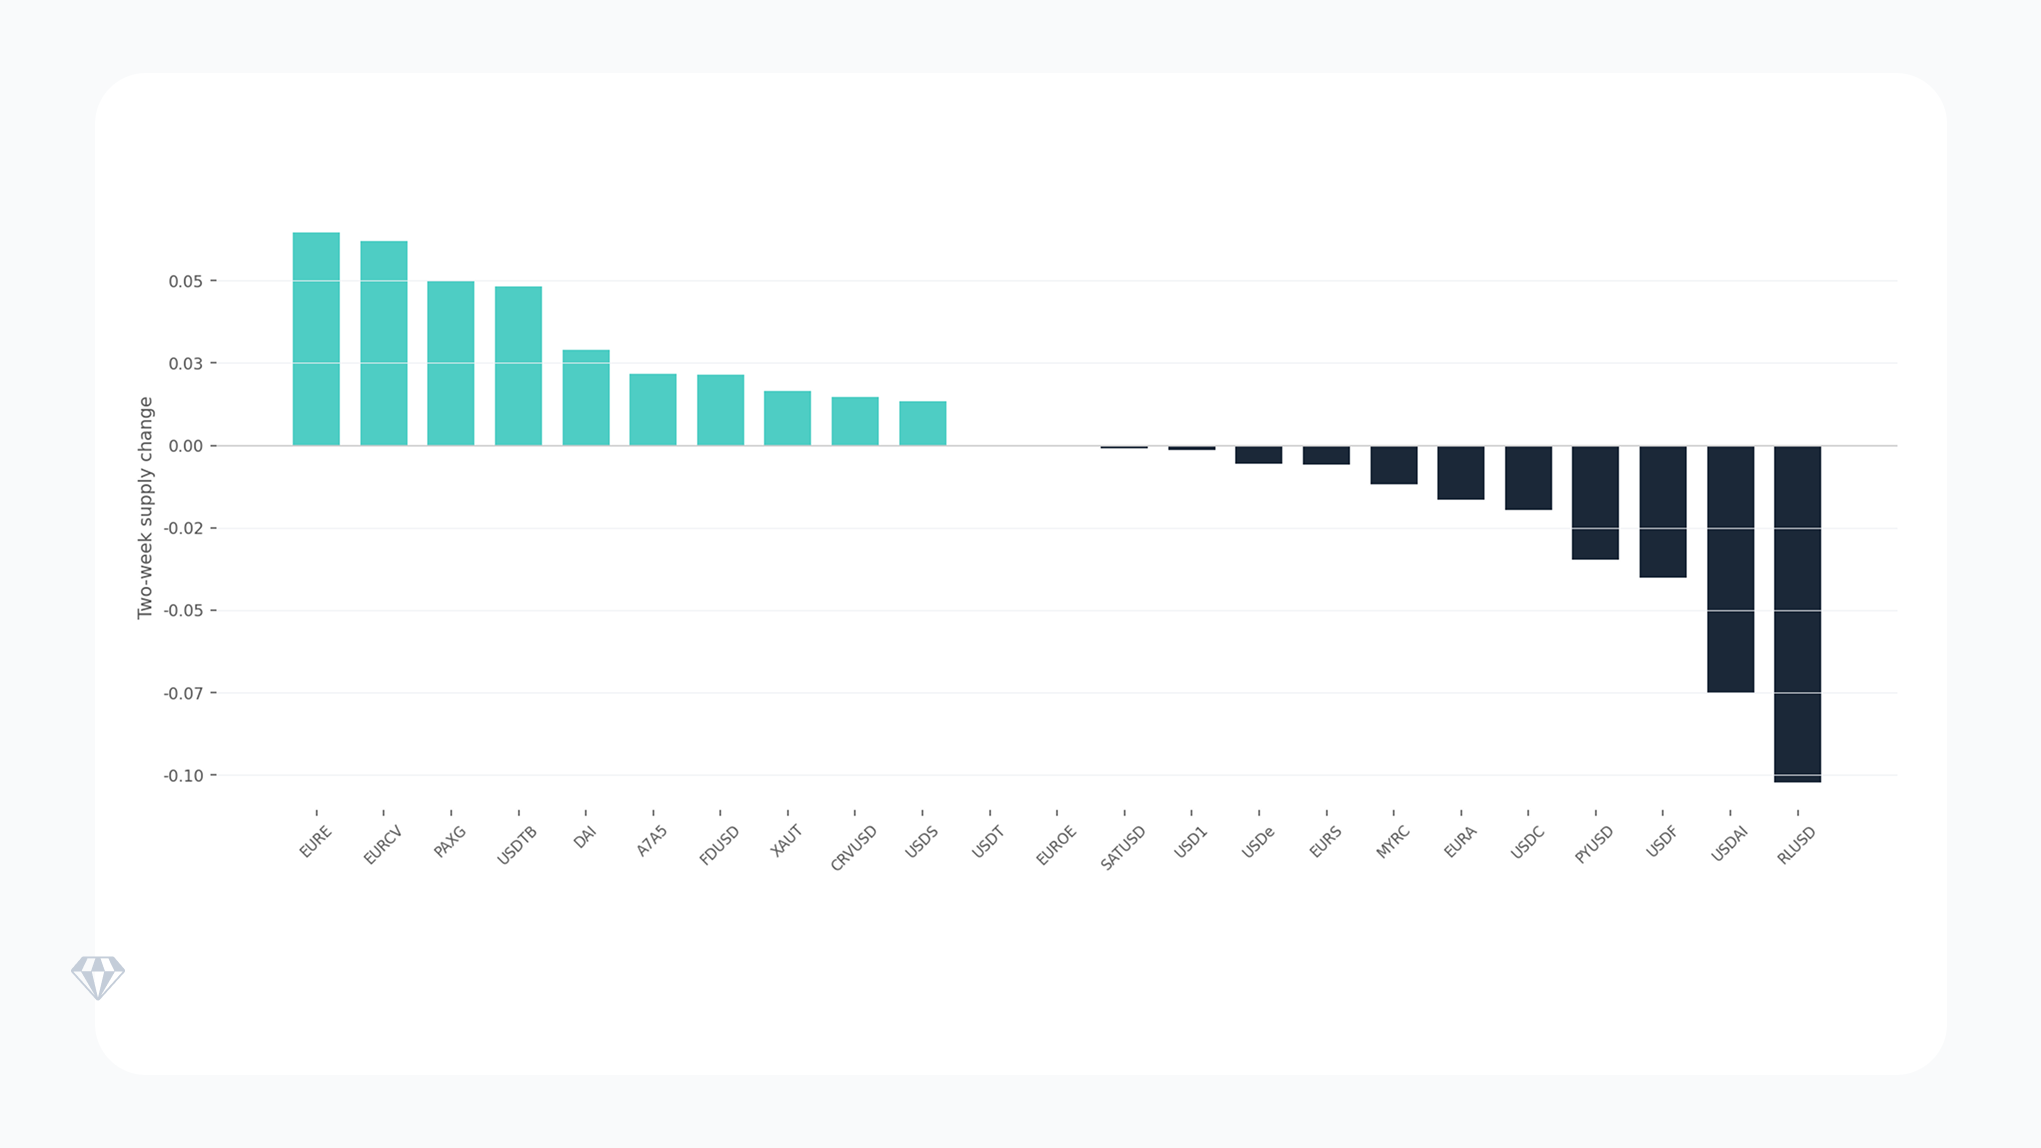
Two-week market cap change
The chart below shows the two-week percentage change in market capitalisation across all tracked assets. Euro-denominated stablecoins (EURE, EURCV) and gold-backed tokens (PAXG, XAUT) led the gainers, driven by precious metals and euro strength rather than stablecoin-specific demand. RLUSD posted the largest decline at -10.2%, followed by USDAI at -7.5% and USDF at -4.0%.
On a 90-day basis, USDS (+21.2%), USD1 (+29.4%), and PAXG (+41.4%) show the strongest structural growth. CRVUSD (-31.9%), USDAI (-53.7%), and EURA (-87.3%) show the steepest structural declines. The 365-day view reveals PYUSD (+440%) and RLUSD (+368%) as the year’s largest new entrant expansions, though both carry settlement quality ratios below 40%.
Supply dynamics: net expansion of $360.6M
Expanding: $662.1M across eight assets
USDS added $426.7M, the largest single-asset expansion. USDC added $179.1M. Smaller expansions came from EURCV (+$5.9M), USDe (+$4.1M), and EURE (+$531K). The question for any supply expansion is whether it corresponds to genuine demand. USDS maintains only 1.3% organic share from $21.5B gross volume – meaning over 98% of its transfer activity serves collateral mechanics rather than payment settlement. USDC’s expansion aligns with its role as DEX infrastructure. Neither expansion signals organic payment adoption.
Contracting: $301.5M across seven assets
DAI led contractions at -$100.7M, followed by USDT (-$71.8M) and RLUSD (-$67.9M). USDT’s contraction is modest relative to its $184.1B market cap and does not appear to signal stress – organic share actually improved slightly (+0.8pp). RLUSD’s contraction coincides with its sharp organic share decline, which may indicate users withdrawing from a deteriorating settlement environment. DAI continues its long-term contraction trend as collateral-dominated activity gradually migrates to newer protocols.
Signals to watch
Velocity and settlement quality
Transfer velocity measures how quickly supply circulates. High velocity paired with high organic share indicates genuine payment utility. High velocity paired with low organic share indicates protocol cycling. A7A5 leads at 7.6% daily velocity with 100% organic share – the market’s cleanest signal of payment activity. EURE shows 2.7% velocity with improving organic share (up 16.9pp to 25.6%), suggesting growing real-world use. USDT circulates at 1.3% velocity with 54.8% organic share, proving that payment utility can scale at massive capitalisation levels.
Momentum shifts
USDAI posted a 2,711% acceleration in net transfer activity ($14.1M versus $500K prior average). SATUSD accelerated 167% but maintains 0% organic share – pure DEX mechanics. RLUSD accelerated 38.8% in net transfers while its organic share fell 13.5pp, suggesting increased exchange routing rather than direct payment growth. Precious metals assets (PAXG -81.4%, XAUT -42.2%) retreated sharply from prior-week volatility.
Risks and open questions
Settlement quality instability. Ten assets experienced organic share swings exceeding 5pp in a single week. This breadth of volatility makes it harder for institutions to assess settlement reliability. When an asset’s genuine usage ratio can shift by double digits week-over-week, any volume-based risk model needs recalibration.
Supply-settlement disconnect. USDS expanded supply by $426.7M while producing only $288.2M in genuine money movement for the entire week. USDC added $179.1M in supply while maintaining 6.1% organic share. For assets whose primary expansion driver is protocol mechanics rather than payment demand, the sustainability of that expansion depends on DeFi activity that may prove cyclical.
Headline volume inflation. Three assets (USDC, DAI, PYUSD) posted rising gross volume alongside declining organic share. This is the clearest indicator that headline figures overstate genuine adoption. Of $1.79T in USDC gross volume, $1.68T facilitates token swap mechanics rather than value transfer.
These patterns raise specific questions for the coming week. Can USDAI sustain its settlement quality above 80%? Will RLUSD’s organic decline stabilise or accelerate? Does USDS supply growth continue without corresponding settlement utility? How many additional assets will experience organic share swings above 5pp? Crystal Foresight will track each of these in next week’s edition.