
Crystal Foresight tracks stablecoin flows, lending activity, and institutional credit across public blockchains. This report maps what over $300B in stablecoins is actually doing – and what that activity reveals about the system being built around it.
Key takeaways
-
A parallel financial system now operates at institutional scale on public blockchains. It has lending markets, savings products, repo auctions, tokenized T-bills, and institutional credit funds – all running on stablecoins. $551.7B in cumulative borrowing has flowed through these systems since 2020.
-
Most of that borrowing is leverage, not productive lending. 41.4% is backed by Bitcoin or Ether. Another 32.2% is stablecoin-on-stablecoin. The dominant use case is crypto holders borrowing more crypto – not businesses funding operations.
-
Headline numbers overstate genuine activity. $41.8B flowed into one savings product in 90 days – but roughly 80% came through the protocol’s own infrastructure, not user wallets. The same dollar cycling through interconnected protocols gets counted at each step.
-
Every instrument has a traditional finance equivalent. The scale of composability does not.Your money market fund units can’t be posted as collateral for a margin loan that funds a T-bill purchase in a single transaction that settles in 15 seconds. On-chain, they can.
Complex financial instruments have a history of developing quietly – understood by specialists, invisible to everyone else. As the financial system moves on-chain, that pattern is breaking. Every loan, every rate, every settlement is recorded on a public ledger.
The complexity isn’t shrinking – the way instruments stack on top of each other and interact automatically is adding layers of interconnection that have no traditional parallel. What’s different is that this complexity is developing in public. Anyone can watch it build in real time and trace where pressure is accumulating.
This report is an attempt to do exactly that. Think of the cut-away scenes in The Big Short where someone explains a financial instrument in plain language so the audience can follow the plot. Same approach here, applied to the instruments that are actively reshaping how capital moves on-chain.
What’s been built
Over the last five years, a parallel financial system has been assembled on public blockchains. It has its own lending markets, its own savings products, its own repo auctions, its own equivalents of Treasury bills, and its own institutional credit funds – built on cryptocurrency, tokenized real-world assets, and stablecoins. This report focuses on the stablecoin layer, which has emerged as the dominant settlement currency of the system.
The starting point is familiar: the $270B in USDT and USDC supply sits primarily in US Treasury bills, earning roughly $12.2B per year for Tether and Circle. That yield stays with the issuer, not the stablecoin holders. For USDG, the yield on $2.8B in supply is shared with distribution partners like OKX, Kraken, and Robinhood. That’s the bridge between the traditional system and the new one — stablecoins are embedded in traditional fixed-income markets. Once the tokenized dollars are distributed on-chain, that’s where the new layer of financial instruments is built.
Pendle is an example of this. It strips yield-bearing stablecoin assets into two components — exactly as investment banks have stripped Treasury bonds into principal and coupon receipts since the 1980s. The result, PT-USDG, functions like a T-bill: buy at a discount, receive exactly $1.00 at maturity. The pool has grown to $230.2M, with $84.3M arriving in May alone. On the 28th of this month, the protocol automatically redeems every token at $1.00 — no custodian call, no two-day clearing window, the entire $230.2M settling in a single on-chain transaction at a price fixed at launch. Same economics as a T-bill. Different layers of trust: Pendle’s smart contract, Paxos as issuer, DBS Bank as custodian, then finally US Treasuries at the base.
The lending markets work like a pawn shop with no owner, no hours, and no location. You bring in something valuable, deposit it as collateral, and borrow against it. The rules are written in code and enforced automatically. Protocols like Aave, Compound, and Spark have processed $551.7B in cumulative gross borrowing this way. 864,557 distinct wallets have used these systems.
Beyond lending, yield-bearing stablecoins now let holders earn interest through mechanisms ranging from lending spreads to delta-neutral carry trades. On-chain repo auctions run regularly, explicitly modeled on the tri-party repo system that moves roughly four trillion dollars per day in traditional markets. Tokenized T-bills offer fixed-return, fixed-maturity positions settled entirely on-chain. And institutional credit platforms manage billions in structured loans with fixed rates and full repayment histories visible to anyone.
This is no longer experimental. On-chain credit rates are compressing in line with broader monetary policy – the same macro signals that move traditional markets are now visible in DeFi. Institutional participants are present. The infrastructure for a parallel credit market exists at meaningful scale.
What the numbers actually show
The scale is real. What matters is what’s underneath it.
Most borrowing is leveraged, not productive lending. 41.4% of on-chain borrowing volume is backed by Bitcoin or Ether – crypto holders borrowing more crypto. Another 32.2% is stablecoin-on-stablecoin, which sounds circular because it is. The most common pattern: deposit a stablecoin, borrow another stablecoin, redeposit as collateral, borrow more. This is called looping – a recursive leverage strategy that amplifies both returns and risk. Our analysis identifies 2.8% of volume as explicit looping within single transactions, but cross-transaction looping would push the true figure substantially higher.
These platforms have no mechanism for real-world lending – no identity verification, no legal recourse, no way to lend against a company’s revenue or property. What this market actually is: primarily a leverage facility for crypto holders, not a general-purpose credit market.
Headline flow volumes overstate genuine user activity. $41.8B USDS flowed into Sky’s sUSDS savings product in 90 days — extraordinary for a stablecoin with roughly $11.0B in total supply. When we traced who was actually depositing, roughly 80% came through Sky’s own routing infrastructure — Spark PSM contracts — rather than directly from user wallets. Tracing the senders back further revealed more of the same: Sky’s governance system, Spark lending pools, Morpho vaults, Aave. The same dollar cycling through interconnected protocols gets counted at each step. $41.8B measures how busy the plumbing is, not how many people are using it.
Concentration is higher than it appears. Term Finance runs on-chain repo auctions modeled on tri-party repo. The data tells two stories:
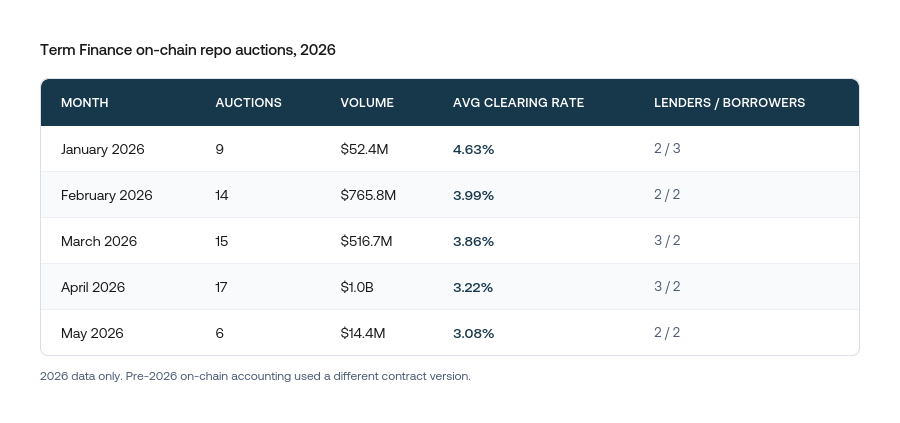
Term Finance on-chain repo auction data showing rate compression from 4.63% to 3.08% in 2026
Two to three lenders, two to three borrowers per auction. This isn’t a retail market. These are institutional counterparties choosing on-chain infrastructure for its settlement efficiency. At this participation level, the “clearing rate” is less a market-discovered price and more a bilateral negotiation with on-chain mechanics. Genuine price discovery requires competing bids from multiple independent counterparties. That depth isn’t here yet.
But the rates themselves are significant. The compression from 4.63% in January to 3.08% by May almost precisely mirrors the rate environment in traditional credit markets over the same period. For the first time, on-chain credit is pricing the same macro signals as off-chain credit. Whether that coherence holds under stress is untested.
The composability question
Every instrument described above has a traditional finance equivalent. Overcollateralized lending is securities-based lending. Repo markets exist. Zero-coupon bonds exist. Money market funds exist. A finance expert from 2019 would recognize all of them.
What they wouldn’t recognize is the composability – the way these instruments stack on top of each other automatically.
In traditional finance, these products live in separate institutions. Your money market fund units can’t be posted as collateral for a margin loan that funds a T-bill purchase in a single transaction that settles in 15 seconds. On-chain, they can. The result is that the same dollar can flow through Aave, into Spark, into Morpho, into a savings vault – and be counted at each step. Researchers describe this as the “DeFi money multiplier.” Published research found this ratio approaching 2x at peak activity. Our data on protocol-to-protocol flows shows the same dynamic in real time.
Mortgage-backed securities were an early version of this layering: instruments built on top of instruments until almost nobody understood what was underneath. On-chain composability echoes that pattern – with one meaningful structural difference. The underlying collateral is visible and verifiable in real time. But visibility doesn’teliminate the complexity of the stack, and it doesn’t fix the incentives of everyone participating in it.
The failure mode is also new. When collateral prices drop, automated liquidation bots seize and sell positions within the same block – no desk, no discretion, no workout process. In calm markets, this is efficient. In a fast-moving market with correlated collateral and thin liquidity, simultaneous liquidations across thousands of positions can create cascades with no human in the loop. This has happened before – March 2020, May 2022 – and the system recovered. But the failure mode is distinct from anything in the traditional finance playbook.
What’s different this time
The most structurally unprecedented feature of this system isn’t any single instrument. It’s the transparency.
Maple Finance is the closest thing on-chain to a traditional credit fund – $3.8B under management, institutional borrowers, structured loan terms, fixed interest rates. In traditional institutional lending, a fund’s loan book is closely guarded. Here, the entire loan book is public: $1.2B outstanding across active loans, every origination date, every rate, every repayment – queryable by anyone, right now.
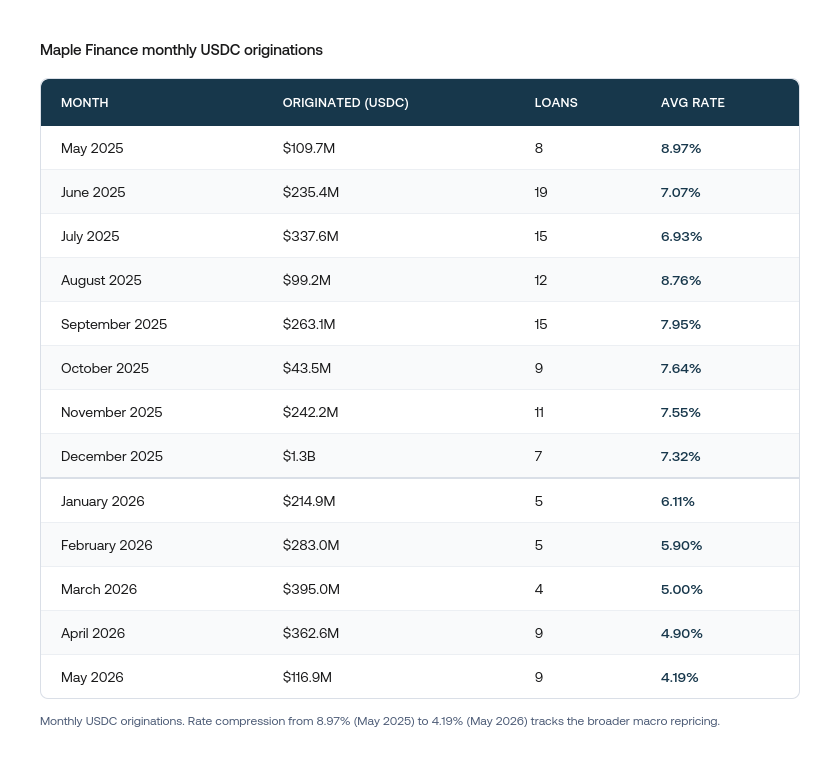
Monthly USDC originations on Maple Finance from May 2025 to May 2026 showing rate compression from 8.97% to 4.19%
The rate compression from 8.97% to 4.19% over 12 months tells the same story as the Term Finance data: on-chain credit markets are beginning to price real-world monetary conditions. The one dimension that remains private is the identity behind each wallet address – Maple’s pool operators conduct off-chain KYC before lending, but the name-to-address mapping isn’t published on-chain. Mapping addresses to real-world entities is work that blockchain analytics companies like Crystal Intelligence do.
In 2008, the pressure points that preceded the crisis – concentrated collateral, correlated exposures, leverage building in one corner of the system – weren’t visible to anyone outside a small number of institutions. Some people saw it coming. Most couldn’t, because the information didn’t exist in accessible form. Here, it does. Every loan, every rate, every position, every liquidation is public, in real time, queryable by anyone willing to look. That doesn’t fix the incentive problems that can drive a cycle to excess. It does mean the excuse of opacity is smaller than it’s ever been.
The question is whether enough people are paying attention while it matters. This is what it looks like today.
Frequently asked questions
What is on-chain lending?
On-chain lending protocols like Aave and Compound operate as automated, overcollateralized lending markets. Borrowers deposit crypto assets as collateral and borrow against them – no identity check, no credit score, no loan officer. The rules are written in code and enforced automatically. Unlike traditional bank lending, these platforms can’t make unsecured loans or lend against real-world assets. The dominant use case is crypto holders borrowing more crypto to amplify their positions.
Why do headline DeFi numbers overstate real activity?
On-chain financial instruments stack on top of each other automatically. A dollar deposited into a lending protocol can be borrowed, redeposited into a savings vault, used as collateral elsewhere, and counted at each step. Researchers describe this as the “DeFi money multiplier,” observed approaching 2x at peak activity. It means headline volume figures often overstate the amount of unique capital in the system.
What does it mean that on-chain rates are tracking traditional credit markets?
For years, DeFi interest rates moved primarily with crypto market sentiment. In 2026, on-chain repo auctions and institutional loan rates are compressing in line with broader monetary policy, just as traditional credit markets do. This suggests on-chain credit is beginning to function as a genuine credit market rather than a purely speculative venue. Whether this coherence holds under stress hasn’t been tested.
Are on-chain loans anonymous?
Not exactly. Institutional platforms like Maple Finance conduct off-chain KYC and credit due diligence before lending. The borrowers are known entities who have agreed to specific terms and are actively repaying. What remains private is the name-to-address mapping – you can see every loan’s terms, rate, and repayment history on-chain, but the legal entity behind each wallet address isn’t publicly disclosed. Mapping addresses to real-world entities is work that blockchain analytics companies like Crystal Intelligence do.
Crystal Foresight: on-chain finance intelligence
Crystal Foresight tracks stablecoin flows, lending activity, and credit markets across public blockchains. The platform provides institutional-grade analytics on supply dynamics, transfer patterns, and market structure – giving compliance teams, investigators, and institutional participants the data to understand what’s actually happening on-chain.
Data as of May 19, 2026. All figures derived from Crystal Intelligence on-chain analytics and Dune Analytics queries. Cumulative gross borrow reflects total borrow transaction volume since 2020 across Aave, Compound, Spark, and related protocols – not current outstanding balances. sUSDS flow figures include protocol-to-protocol transfers and should not be interpreted as net new user deposits. This report is for informational purposes only and does not constitute investment advice.