
Crystal Foresight tracks supply, transfer activity, and genuine usage across the major dollar stablecoins — data used by compliance teams, institutional participants, and stablecoin issuers themselves. The top ten dollar tokens ended the first half of 2026 at about $292.9B. The story is not at the top.
Key takeaways
- USDT and USDC held their lead. Together they account for 89% of the top ten by market cap. Their combined share barely shifted across the quarter.
- USDG was the quarter’s fastest grower; but on rewards, not demand. Global Dollar’s token rose 69% in 90 days to $2.84B. That growth was achieved through exchange reward programs that paid holders 3.5-4.1% a year. A third of USDG’s volume is still exchange routing rather than payments.
- Two yield-driven tokens reversed sharply. Ethena’s USDe fell 24% to $4.48B as its staking yield compressed. PayPal’s PYUSD dropped 30% to $2.75B.
- The growth that held came from settlement rails, not rates. Ripple’s RLUSD rose 11% to $1.60B on the back of payment mandates. It carries the healthiest genuine-use profile of the quarter’s risers; 36% of its volume is real money movement.
- A rising market cap and a broad user base are not the same thing. Several tokens that grew in Q2 remain concentrated in a handful of wallets and show low genuine-use share. Size is not adoption.
Market snapshot
The table below covers the nine largest dollar stablecoins tracked by Crystal Foresight as of June 24, 2026. The “genuine-use share” column shows the share of each token’s transfer volume that represents real money movement such as payments, peer-to-peer transfers, and settlement which are distinct from exchange routing, automated protocol mechanics, and issuer operations. It is the closest available on-chain measure of whether a stablecoin is functioning as money. “Top-10 held” shows the share of supply sitting in the ten largest wallets, a measure of how concentrated ownership is.
Token | Issuer | Market cap | 90-day change | Genuine-use share | Top-10 held |
USDT | Tether | $186.1B | +1.1% | 50.2% | 25% |
USDC | Circle | $74.2B | -5.7% | 8.6% | 26% |
USDS | Sky | $10.3B | -11.6% | 2.8% | 93% |
DAI | Sky | $4.87B | +6.6% | 4.6% | 40% |
USD1 | World Liberty | $4.80B | +8.5% | 9.6% | 82% |
USDe | Ethena | $4.48B | -24.2% | 24.8% | 96% |
USDG | Paxos / Global Dollar | $2.84B | +69.1% | 32.6% | 59% |
PYUSD | PayPal | $2.75B | -30.2% | 17.5% | 76% |
RLUSD | Ripple | $1.60B | +11.1% | 35.6% | 69% |
Figures as of June 24, 2026. Genuine-use share is calculated against gross transfer volume over the past week. Top-10 held is the share of supply in the ten largest wallets. Market caps are approximate; confirm a live figure before publication.
90 change in market cap, top dollar stablecoins (excludes gold-backed tokens)
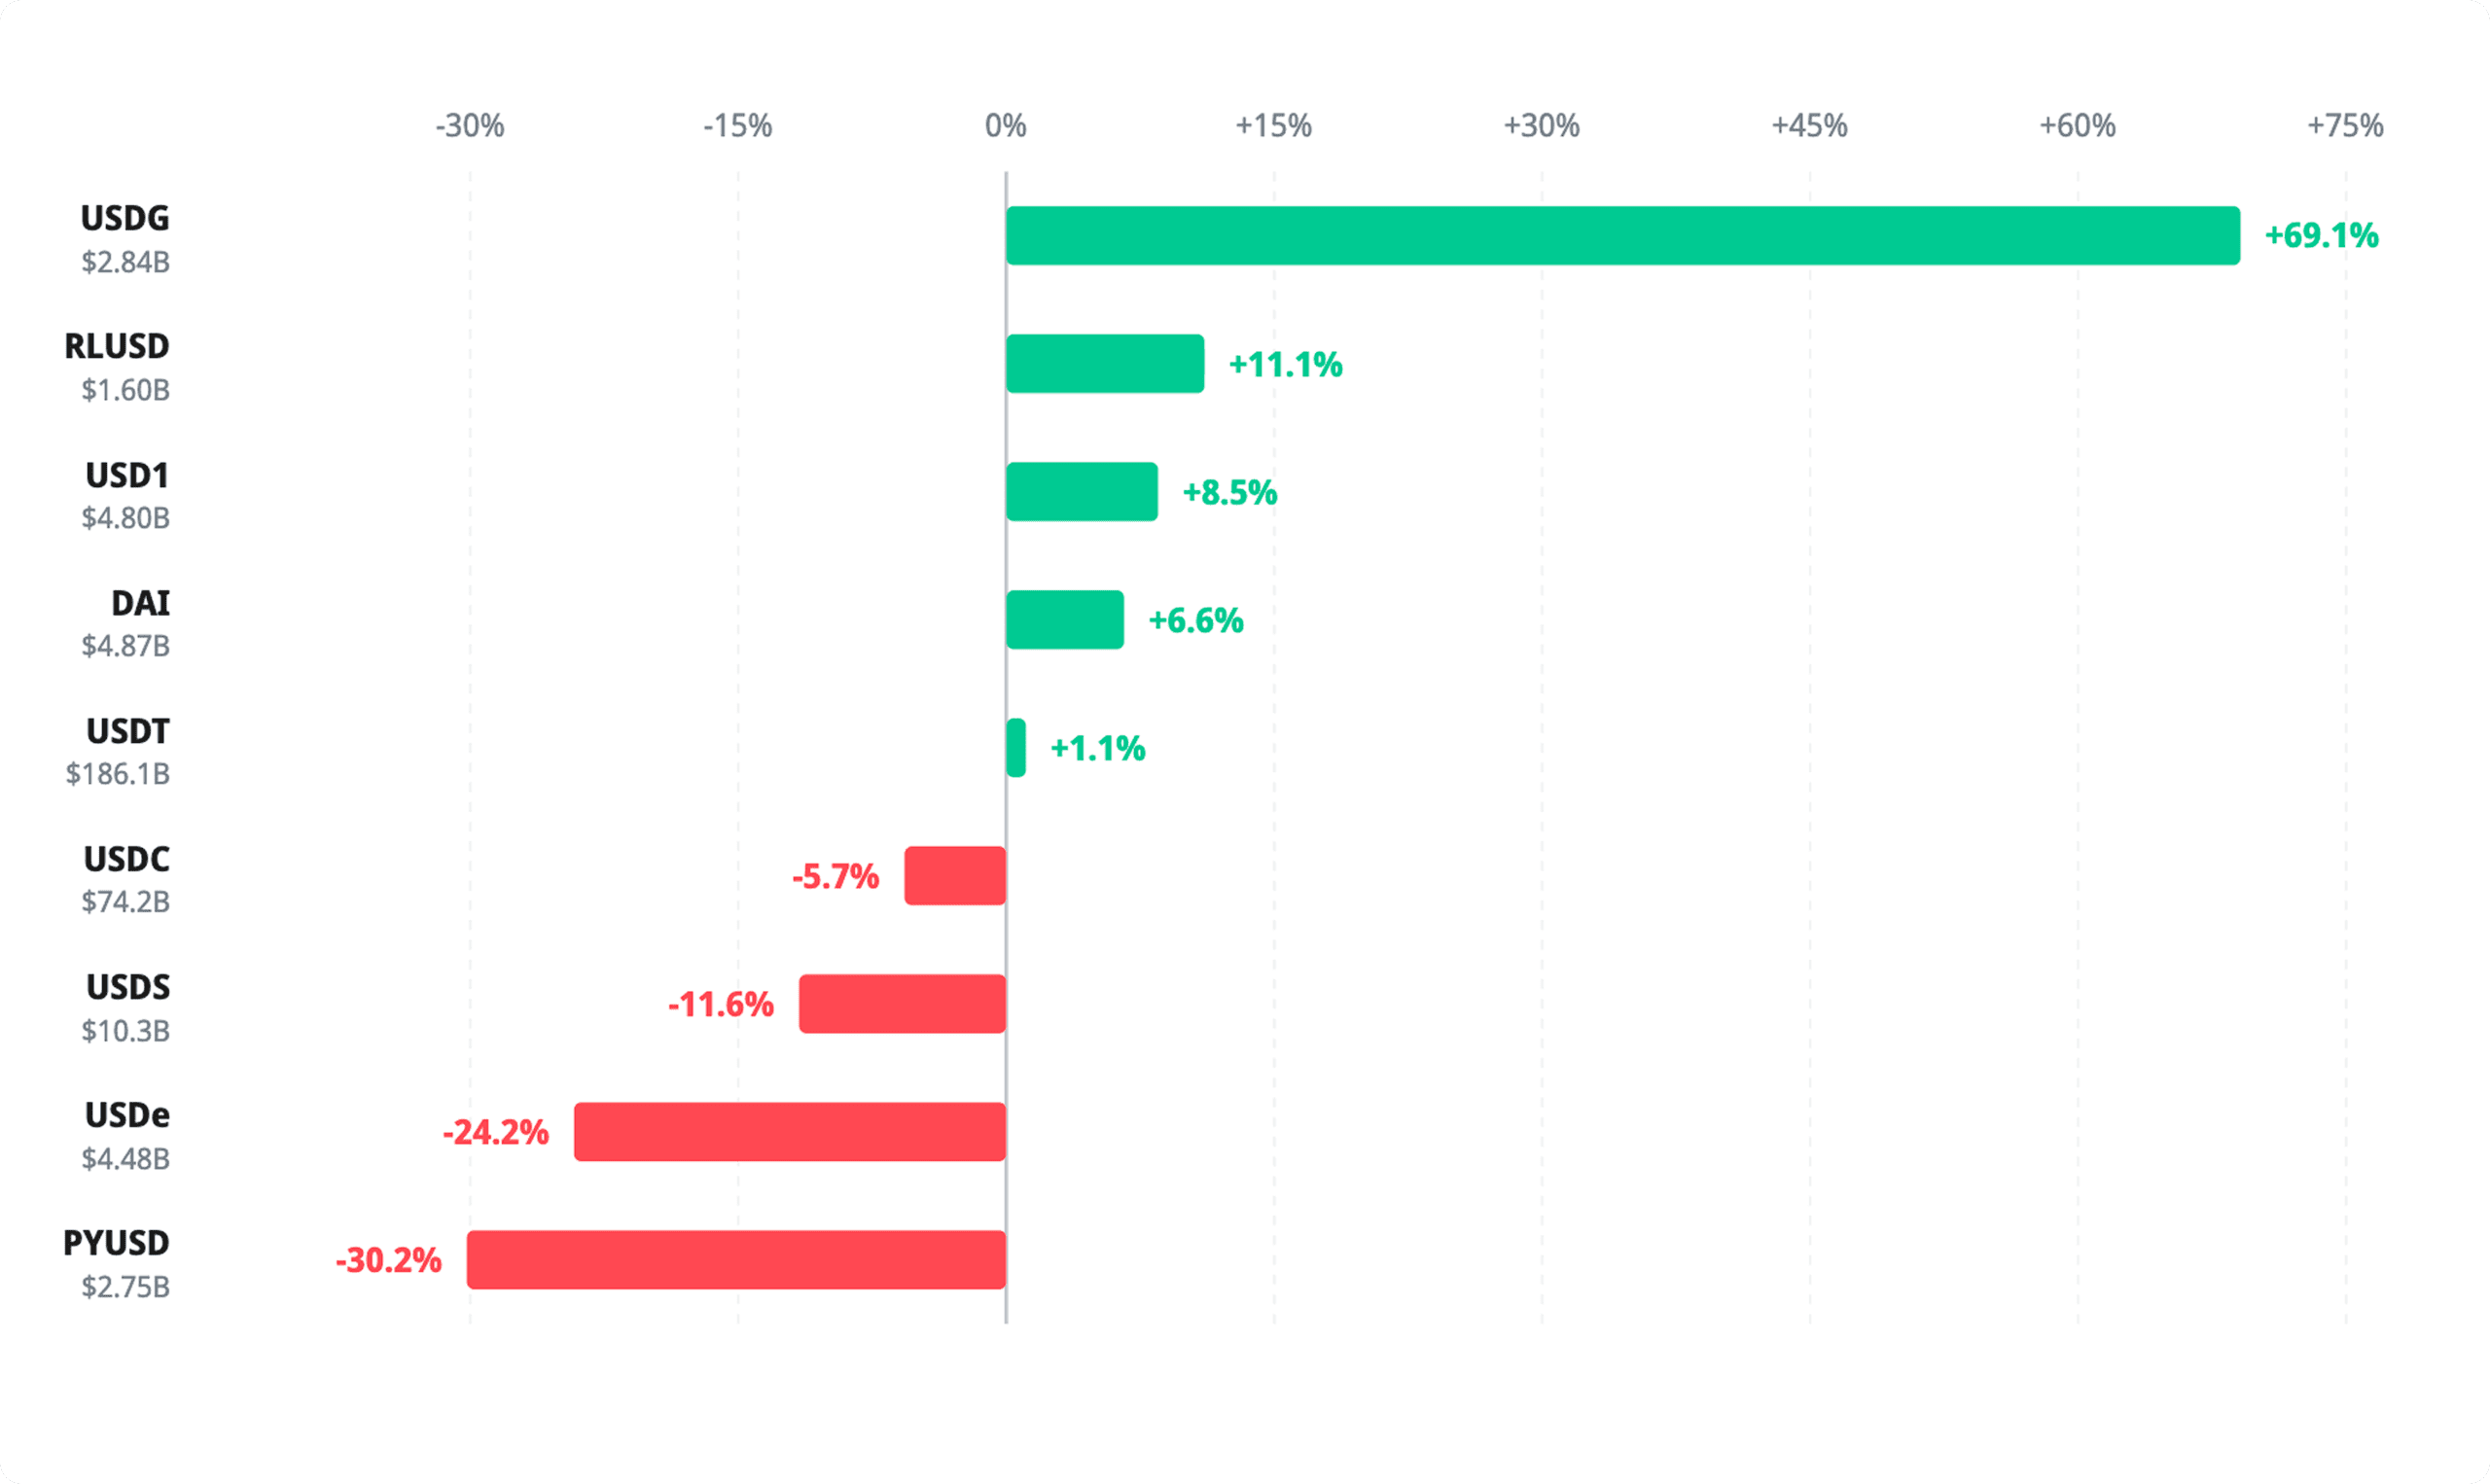
The two giants barely shifted – USDT up 1.1% and USDC down 5-7% – while tokens beneath them swung double digits in both directions. Global Dollar’s USDG led on exchange rewards (+69.1% to $2.84B); last year’s yield star, Ehtena’s USDe, fell hardest among the majors (-24.2% to $4.48B) as its staking yield compressed.
Three patterns stand out. USDT’s 50.2% genuine-use share is by some distance the highest in the table, and as the largest token, it also has the most distributed, payment-oriented activity. The yield-backed tokens (USDe, USDS, DAI) cluster at the low end of genuine-use share: below 5% for USDS, below 25% for USDe. And several of the fastest growers — USD1 at 82% top-10 concentration, USDS at 93%, USDe at 96% — remain held by a very small number of wallets.
What kind of growth actually worked
The challenger field in Q2 is sorted by each token’s growth, and the answer marks a shift from 2025. Last year, the highest-yielding stocks attracted the most supply. In the first half of 2026, yield stopped being the engine.
Ethena’s USDe is the clearest example. It was 2025’s growth story — an instrument that paid double-digit returns and gathered supply quickly. As its staking yield compressed from about 9.4% in spring to the low single digits, supply followed suit. USDe shed 24% to $4.48B. Supply bought with yield leaves when the yield drops. PYUSD’s 30% decline tells a quieter version of the same story — a token still searching for a use that outlasts incentives.
The growth that worked came from two other places. Some was bought: USDG rose 69% to $2.84B — the quarter’s biggest gain — on a rewards program that pays holders via exchanges such as OKX. It is growth by design, and 32.6% genuine-use share means a third of its volume is real money movement, which is creditable. But 59% of supply sits in the top ten wallets, and a third of volume remains exchange routing.
Some was built: Ripple’s RLUSD added 11% to $1.60B on settlement mandates. The most visible instance was Ripple’s strategic stake in Flutterwave’s Series E, which valued the payments company at $3.2B and embedded RLUSD as its primary cross-border settlement asset. RLUSD carries 35.6% genuine-use share and a third of its volume in direct transfers — the healthiest profile of the quarter’s risers.
USD1 is harder to categorize. World Liberty’s token grew 8.5% to $4.80B as its issuer moved toward a US federal trust charter. That is a regulatory tailwind rather than a commercial one. Exchange routing still accounts for 71% of its volume — the signature of a token being listed rather than spent.
Taken together, the challengers indicate the competition has shifted from who pays the most to who is connected to the most settlement and distribution networks. That is a slower, stickier basis for growth, and a harder one for a newcomer to buy into quickly.
A reality check on who is actually there
The growth rates in Q2 hide a catch worth applying before reading too much into any of them. On-chain, Crystal Foresight tracks not just how much a token moved but how much of that was real — and how many wallets actually hold it.
On both measures, the challengers look thinner than the giants. USDe’s ten largest wallets hold 96% of its supply. USDS stands at 93%. USD1 at 82%. USDT and USDC sit at 25% and 26% respectively. The leaders are broadly distributed money. Several of the Q2 climbers are, for now, a handful of large holders and the protocols built around them.
Geniune-use share of weekly volume vs share of supply in the ten largest wallets
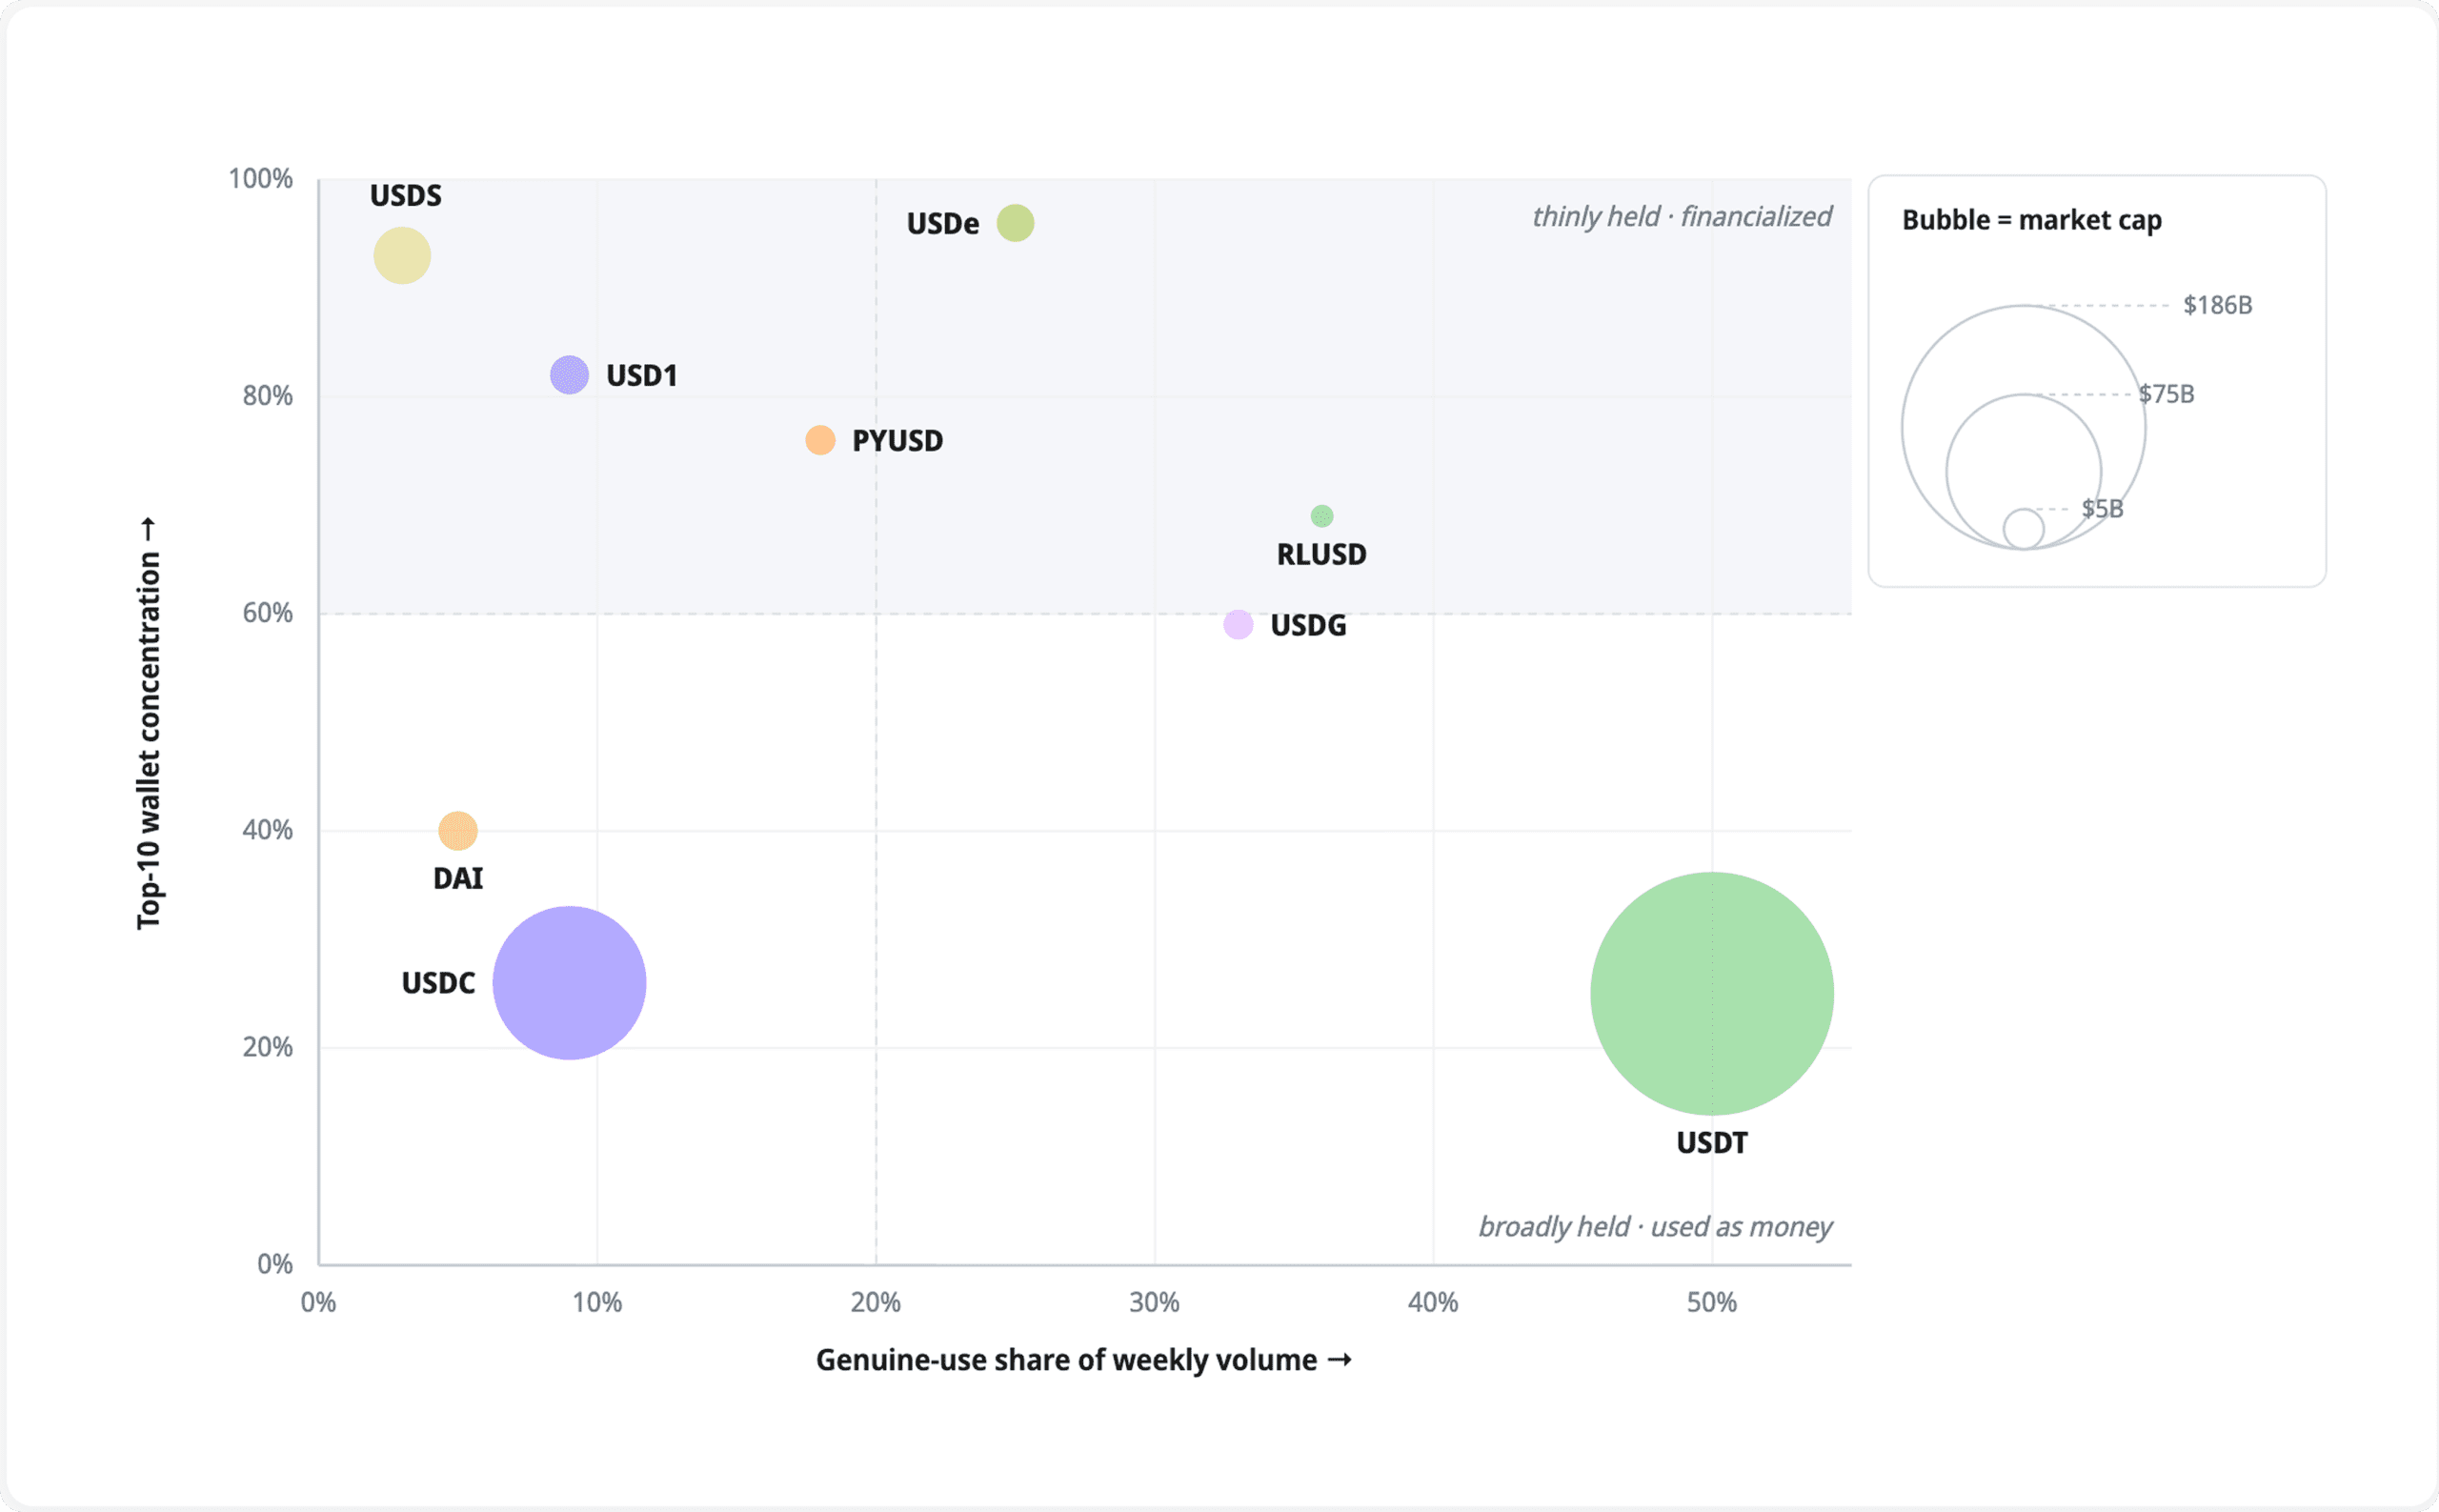
Genuine use = payments + peer-to-peer transfers + real-world settlement as a share of gross 7-day transfer volume. Bubble area scales with market cap.
USDT sits alone in the bottom-right; broadly held and genuinely used as one. The challenges cluster top-left – tightly concentrated, with much of their volume in DeFI mechanics and exchange routing rather than payments. Among the fast rises, RLUSD and USDG convert the most volume into real money movement; USD1, high in the concentration band and low on use, still looks more listed than spent.
The usage picture matches. RLUSD and USDG convert a third or more of their volume into genuine money movement. USD1, at under 10%, is still mostly trading and routing. None of this makes the growth misleading in itself, but a rising market cap and a broadening, paying user base are not yet the same thing in this tier. Only the second one compounds.
The euro pocket: small, fast, and actually backed
The fastest-growing corner of the first half of 2026 is one a January forecast would almost certainly have missed: the euro. It is still a rounding error in dollar terms — about $700M against a $292.9B market — but it was the fastest-moving pocket in Q2. Four of the five quickest-growing stablecoins in the second quarter were euro-denominated.
The June 16 edition of Crystal Foresight covered all seven euro tokens in detail — read the full analysis here. Three findings carry into the half-year picture.
First, the largest euro coin is American. Circle’s EURC — at about $425M — is bigger than every European-issued euro token combined. Its lead reflects early MiCA compliance and the distribution rails it shares with USDC, not grassroots demand.
Second, the label hides very different jobs. Monerium’s EURe is small at about $31M but spread across more than 47,000 wallets and active through card programs — an unusually payments-oriented and decentralized profile for a stablecoin of any currency at this size.
Third, and most striking against the dollar field above: because MiCA’s reserve rules require it, nearly every euro token is backed by euro cash and eurozone government debt. That is unlike crypto- and derivatives-backed dollar tokens such as USDe and USDS. In the first half of 2026, where regulation became a competitive asset, the euro pocket is where that shift is most visible in the backing itself.
What to watch in the second half
- Whether USDG’s and USD1’s holder bases broaden. Both remain concentrated. Durable adoption would show as a rising genuine-use share and a widening wallet count, not a larger cap. The specific signal to watch: genuine-use share crossing above 15% for USD1 and top-10 concentration falling below 70% for USDG.
- Whether yield compression continues to reprice the field. USDe shed 24% as its annualized staking yield fell toward the low single digits. The question for the second half is: which other tokens carry supply bought at a higher yield, and what is their floor? Watch USDe’s staking yield against its week-on-week supply change.
- Whether any European-issued euro token closes the gap on EURC. The Qivalis consortium — 37 banks across 15 countries, including BNP Paribas, ING, and UniCredit — is targeting a second-half 2026 launch, pending approval of its e-money license by the Dutch central bank. If it launches on schedule, it would be the most broadly bank-backed euro stablecoin yet. Watch for on-chain issuance activity.
- Two regulatory decisions with direct supply implications. The OCC charter decision on World Liberty’s issuer would give USD1 a structural basis for growth beyond exchange listings. Any progress toward a CLARITY Act vote would affect the broader regulatory risk premium that several challengers carry.