
Key takeaways
- Concentration dominates mid-cap and large-cap supply. Six tracked assets hold more than 89% of their circulating supply in just 10 wallets. This includes USDS ($11.6B, 91.9% concentrated), USDe ($5.8B, 95.7%), and USD1 ($4.2B, 89.4%). Combined, these assets represent over $26B in market capitalization held in a structurally narrow distribution.
- Transfer activity declined across 13 of 22 tracked assets. Despite $1.41B in net supply expansion, most stablecoins saw reduced transfer volumes week over week. Declines ranged from 10% (DAI) to 85% (USDTb). Supply is growing. Usage, for most assets, is not.
- USDT remains the structural outlier. With 24.7% top-10 concentration, $5.2B in daily net transfers (+10.8% week-over-week), and $184.4B market cap, USDT is the only asset above $1B that pairs broad distribution with strong transfer growth.
- When supply concentration exceeds 90%, standard metrics tell a different story. A single large holder moving funds can generate activity that mimics broad adoption. Concentration data reveals what headline transfer volumes and velocity figures alone cannot.
Market snapshot
The stablecoin market reached $303.6B in total capitalization this week across 26 tracked assets, adding $1.41B in net new supply. By headline measures, growth continues.
But beneath the supply expansion, a structural pattern deserves attention. Six stablecoins now hold more than 89% of their circulating supply in just 10 wallets. At the same time, transfer activity declined across 13 of 22 tracked assets. This creates a market where supply figures grow, but actual fund movement between distinct user contracts does not.
This report examines the implications of wallet concentration for stablecoin market health. Crystal Foresight tracks top-10 holder concentration alongside transfer velocity and supply changes to help readers distinguish between genuine circulation growth and structural accumulation by a small number of large participants.
Market overview: 13 largest assets by capitalization
The table below shows the 13 largest stablecoins by market cap with their supply changes, transfer activity, velocity, and top-10 wallet concentration. The final column is the focus of this report: what share of total supply is held by the 10 largest wallets.
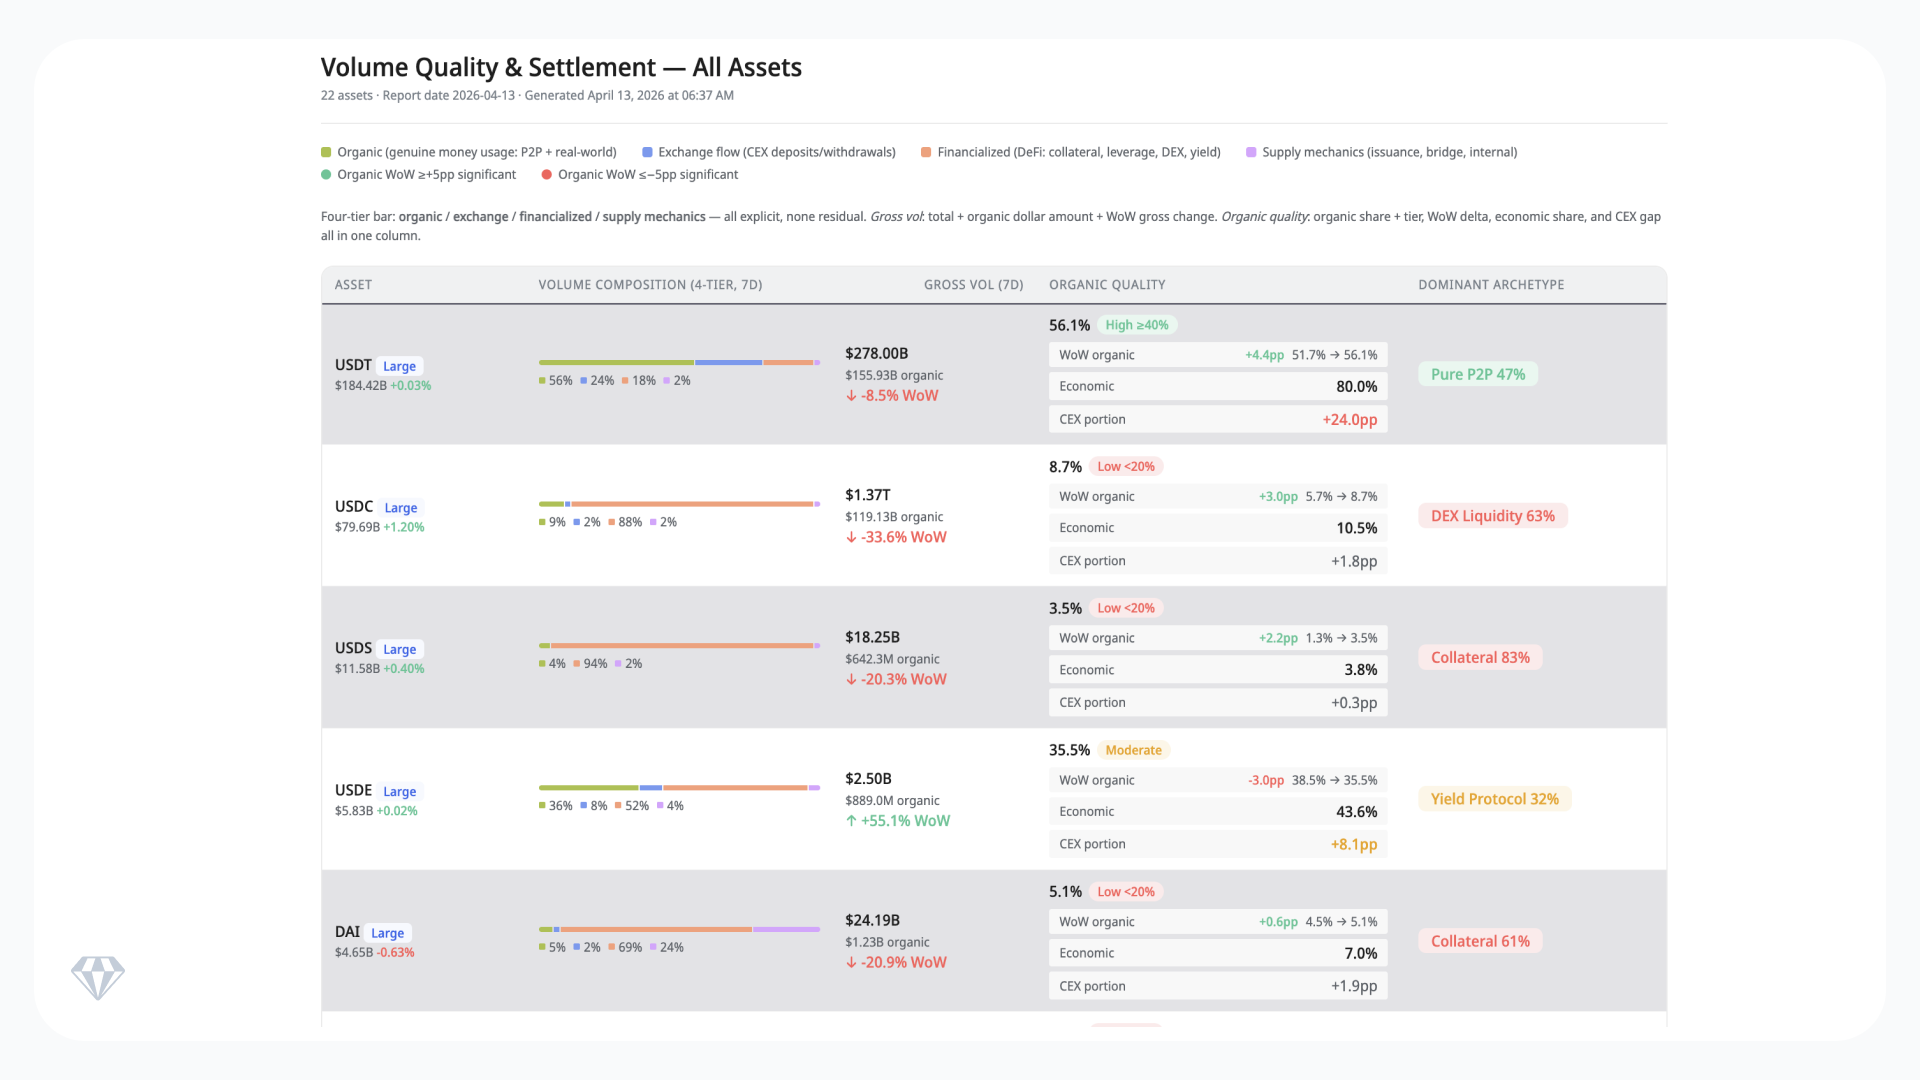
Above: Data for the seven-day period ending April 13, 2026. Source: Crystal Foresight.
Three patterns stand out. First, the four assets with the highest concentration (A7A5 at 97.8%, USDe at 95.7%, FDUSD at 92.7%, USDS at 91.9%) all saw either zero or declining transfer activity. Second, USDT and USDC are the only two assets above $10B with top-10 concentration below 30%. Third, the gap between the two groups is not gradual. Most assets cluster either below 40% concentration or above 77%.
The concentration problem: what it means when 10 wallets hold the supply
Wallet concentration is not inherently negative. Some stablecoins are designed for institutional use cases where a small number of large participants hold most of the supply. But concentration creates structural fragility in three specific ways.
Transfer volume can be misleading. A7A5 shows 97.8% top-10 concentration alongside 3.2% daily velocity. That velocity comes from a very small number of wallets cycling funds. The transfer figures are real, but they do not indicate the breadth of adoption that the same velocity would imply for an asset like USDT.
Redemption risk concentrates. When 10 wallets control over 90% of the supply, a single holder redeeming creates a supply contraction that affects the entire market for that asset. USD1 contracted $145M this week with 89.4% concentration. That contraction likely came from one or two wallets.
USDT provides the contrast case. Its 24.7% top-10 concentration means supply and transfers are distributed across a far wider base of holders. No single wallet action can generate the kind of supply or volume distortion visible in more concentrated assets.
Transfer activity: a broad cooldown with isolated surges
Net transfer activity declined across 13 of 22 tracked assets this week. The declines were not small. USDTb fell 85%. A7A5 dropped 79%. EURS contracted 71%. SATUSD declined 52%. RLUSD dropped 48%. PYUSD fell 40%.
Against this, a smaller group of assets posted transfer gains. USDe rose 83% to $44.4M daily, driven by yield protocol activity. USDAI gained 39% to $19.6M. USDF grew 33%. USDT, the market leader, added 10.8% to reach $5.2B in daily net transfers.
The divergence between supply growth and transfer activity is clearest in three cases. PYUSD expanded by $102M while its transfers fell 40%. RLUSD grew $66M in supply while transfers dropped 48%. In each case, the supply headline tells a growth story. The transfer data tells a different story.
Two-week market cap change
The chart below shows the two-week percentage change in market capitalization for the 13 largest tracked assets. A7A5 leads at +14.0%, followed by XAUT (+4.5%) and PYUSD (+4.0%). USD1 saw the steepest decline at -5.5%, followed by USDe (-0.9%) and USDS (-0.5%).
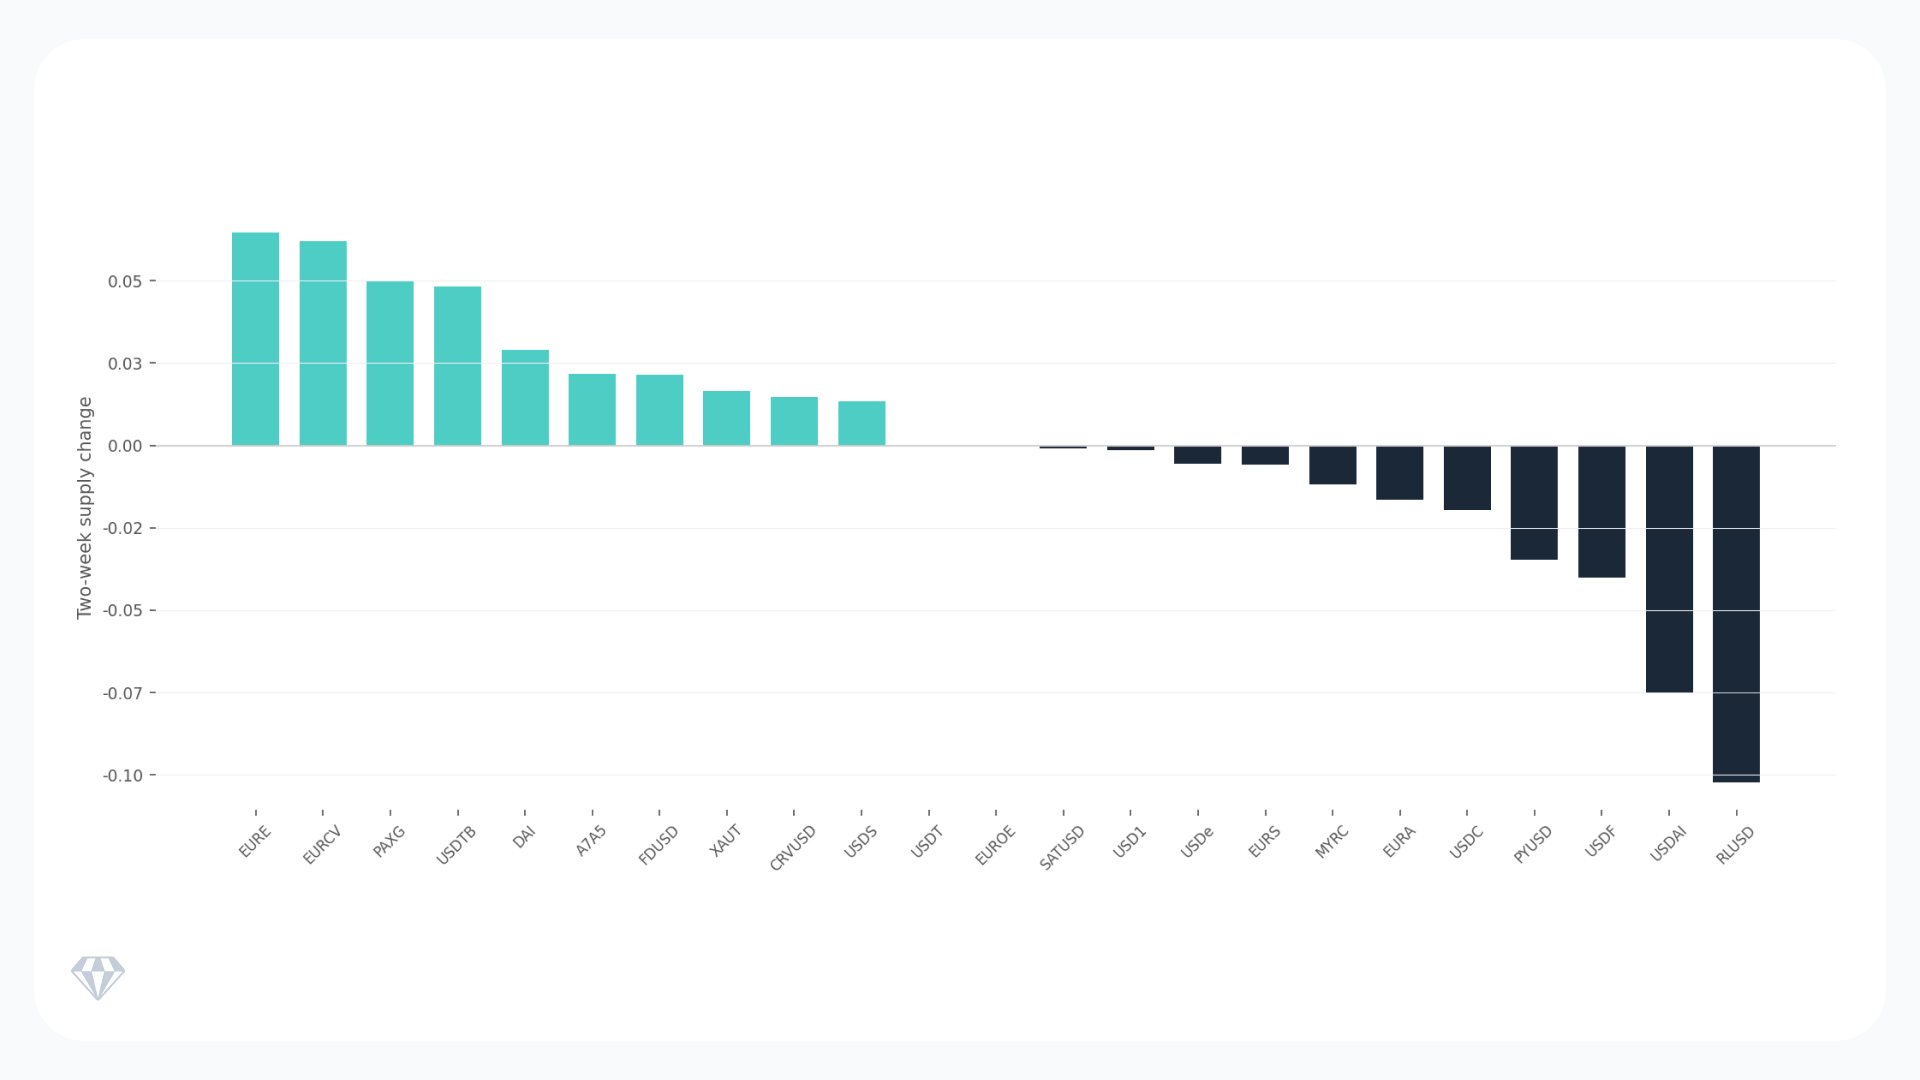
Source: Crystal Foresight. Two-week market cap change for the 13 largest stablecoins by capitalization, ending April 13, 2026.
A7A5’s 14% market cap gain over the past two weeks is notable, given its 79% transfer decline this week. This suggests the growth occurred in the prior week and is now normalizing. The gold-backed tokens XAUT and PAXG both gained as precious metals prices rose during the period.
Supply dynamics: +$1.75B expansion, -$338M contraction
Expanding supply: $1.75B across nine assets
USDC led supply expansion at +$679M, followed closely by USDS at +$674M and USDT at +$472M. PYUSD added $102M, RLUSD grew $66M, and USDAI expanded $55M. The remaining expansions were small: EURCV (+$6.2M), FDUSD (+$4.7M), and USDTb (+$2.5M).
The critical question is whether this expansion reflects genuine demand. USDT’s supply growth accompanies a 10.8% transfer increase. That is a healthy signal. USDS’s $674M expansion accompanies zero transfer activity and 91.9% concentration. That is not.
Contracting supply: $338M across six assets
USD1 led contractions at -$145M, followed by USDe (-$59M), DAI (-$40M), and PAXG (-$31M). USD1’s contraction is structurally significant: it occurred in an asset with 89.4% concentration and zero net transfer volume, suggesting a small number of large holders are exiting.
Signals to watch
PYUSD organic share recovery. PYUSD’s organic share jumped from 17.3% to 38.2% week-over-week, a 20.9 percentage point gain. But its gross volume fell 22%, and net transfers dropped 40%. The organic share improvement came from a compositional shift, not from transfer growth. Whether this signals genuine payment utility improvement or temporary DeFi composition changes will become clearer in the next two weeks.
CRV-USD volume surge. CRV-USD gross volume jumped 894% to $47.5B while organic share rose from 24.7% to 49.8%. This is a rare case where volume growth accompanied quality improvement. Whether this level of activity sustains or reverts to prior levels will test whether the improvement is structural.
A7A5 transfer normalization. A7A5 maintains near-perfect organic share at 99.9% despite a 79% transfer decline. This suggests the prior week was exceptional rather than that this week represents deterioration. But at 97.8% top-10 concentration, the transfer patterns of a very small number of wallets determine the entire activity profile.
Risks and open questions
Concentration-driven fragility. Over $26B in stablecoin market cap sits in assets where 10 wallets hold 89% or more of supply. This creates asymmetric risk: a single large redemption can trigger supply contraction, liquidity withdrawal, and cascading effects that distributed assets do not face. Institutional holders evaluating stablecoin exposure should factor concentration alongside market cap and volume.
Transfer cooling amid supply growth. The divergence between supply expansion ($1.41B net) and broad transfer decline (13 of 22 assets) raises a sustainability question. Supply growth funded by a small number of large participants, without corresponding transfer activity, may not indicate genuine demand expansion. This pattern is most acute in USDS, PYUSD, and RLUSD.
Organic share volatility. Eight assets experienced organic share swings exceeding five percentage points this week. CRV-USD gained 25 points. PYUSD gained 21 points. RLUSD lost nine points. Prior weeks have shown that such swings often reverse. Settlement quality improvements remain fragile without sustained transfer growth underneath them.
Three questions frame the week ahead. Will USDS supply expansion generate any measurable transfer activity? Can PYUSD sustain its organic share above 35% alongside transfer growth? Does the broad transfer cooldown reverse, or does it indicate a structural reduction in stablecoin usage beyond the two largest assets?
Track concentration and settlement quality with Crystal Foresight
Crystal Foresight provides institutional-grade stablecoin analytics, including wallet concentration data, organic share measurement, supply dynamics, and transfer velocity across 26 tracked assets. Updated weekly, the platform helps compliance teams, issuers, and market participants understand what is actually happening with the instruments they hold, accept, or depend on.