
Crystal’s analysis of stablecoin flows from July-September 2025 shows markets have moved beyond growth phase into institutional control, with activity concentrating among a small number of major players.
Key findings:
- USDT dominance solidified: closed Q3 at $175B market cap with daily trading volumes 5x larger than USDC ($40-200B vs $5-40B)
- Institutional concentration intensified: Binance alone processed $10B in outflows during August; multiple single transactions exceeded $5B
- Platform consolidation accelerated: trading concentrated on exchanges offering deepest liquidity, with Uniswap and Curve dominating DEX activity
- Active supply management: September saw coordinated burn activity ($9B+ weekly for USDC), signaling issuers actively manage circulation rather than passive pegging
- Attribution gaps persist: significant high-value transfers remain linked to unlabeled addresses, limiting market participants’ ability to assess counterparty risk and institutional behavior
The data confirms that stablecoins function as managed infrastructure rather than passive assets, with supply decisions concentrated among identifiable institutional players, making entity-level attribution critical for risk assessment and strategic positioning.
The third quarter of 2025, running from July 1 to September 30, 2025, widened the gap between the world’s two largest stablecoins, which together corner some 85% of the current market.
Blockchain intelligence data covering Q3 showed that Tether’s USDT,with about 60% of the overall stablecoin market, steadily reinforced its pole position, closing with a market capitalization (cap) of $175B on September 30.
In contrast, Circle’s USDC, with approximately 25% of the overall stablecoin market cap, experienced more erratic progress during Q3, settling at a market cap of $73.4B by its end.
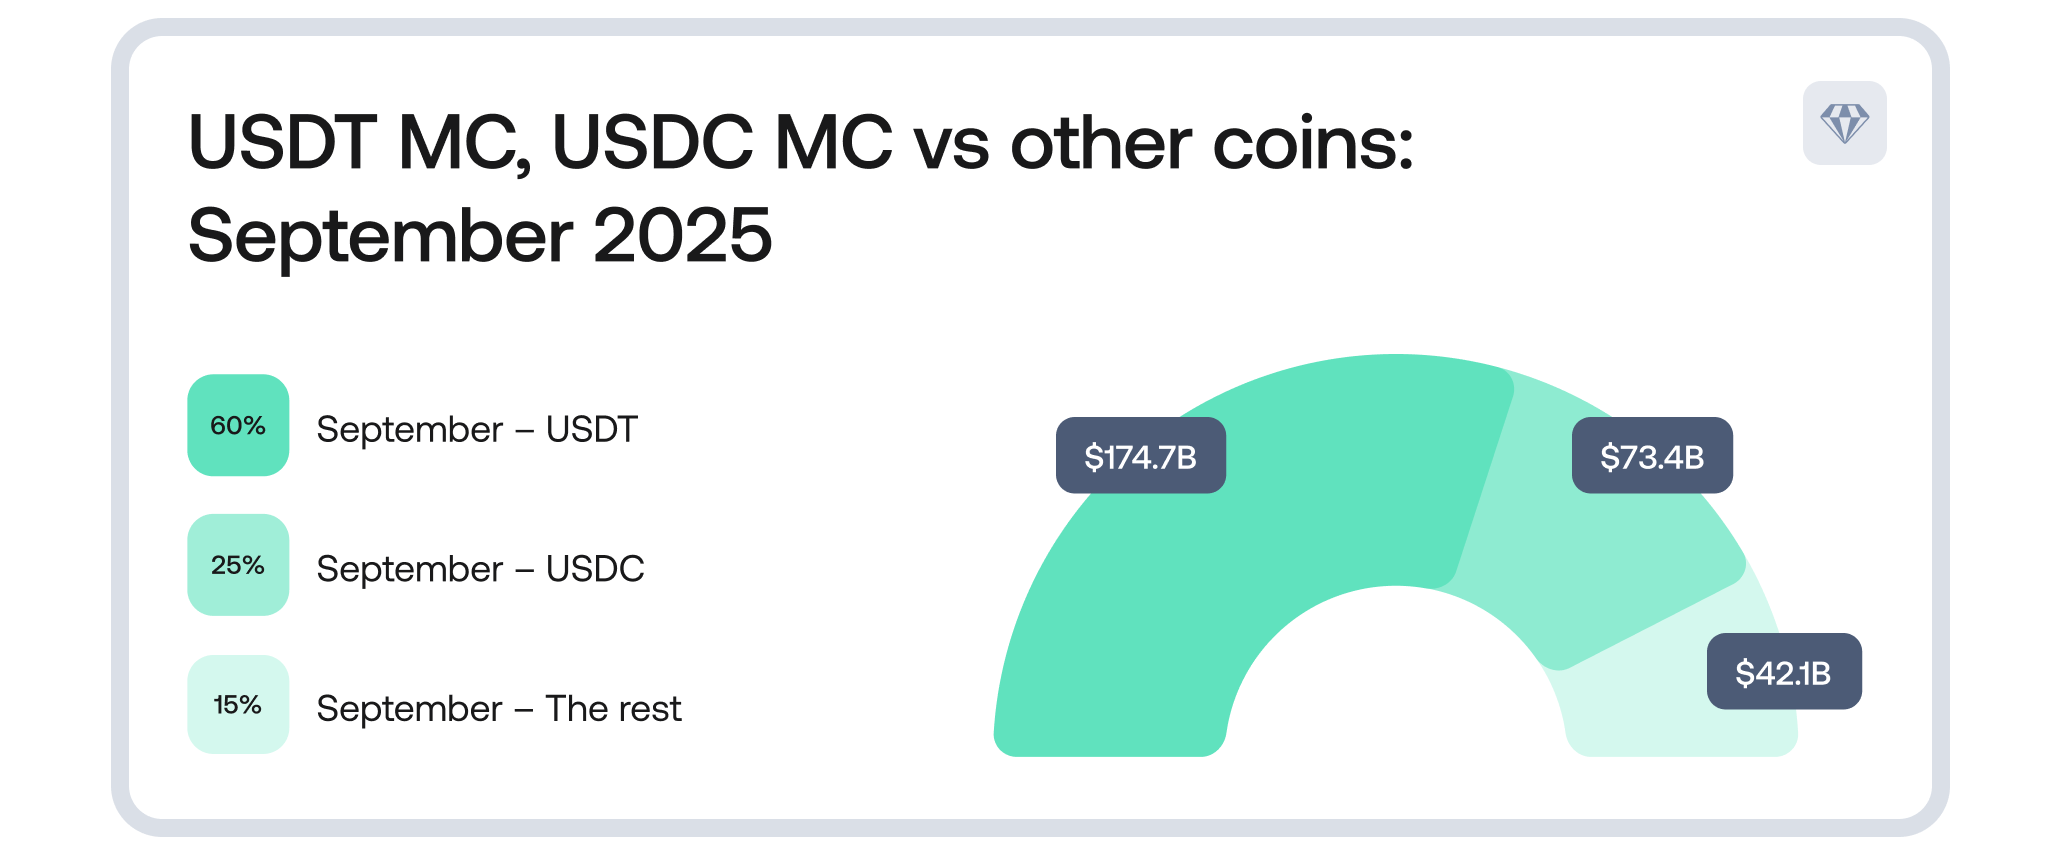
Above: USDT’s Q3 performance – closing at $175B with daily trading volumes worth $144B – cemented its role as the primary liquidity instrument in digital assets markets.
Market cap trends signal structural shifts in how USDT and USDC are used
USDT Market Cap Trend 2025
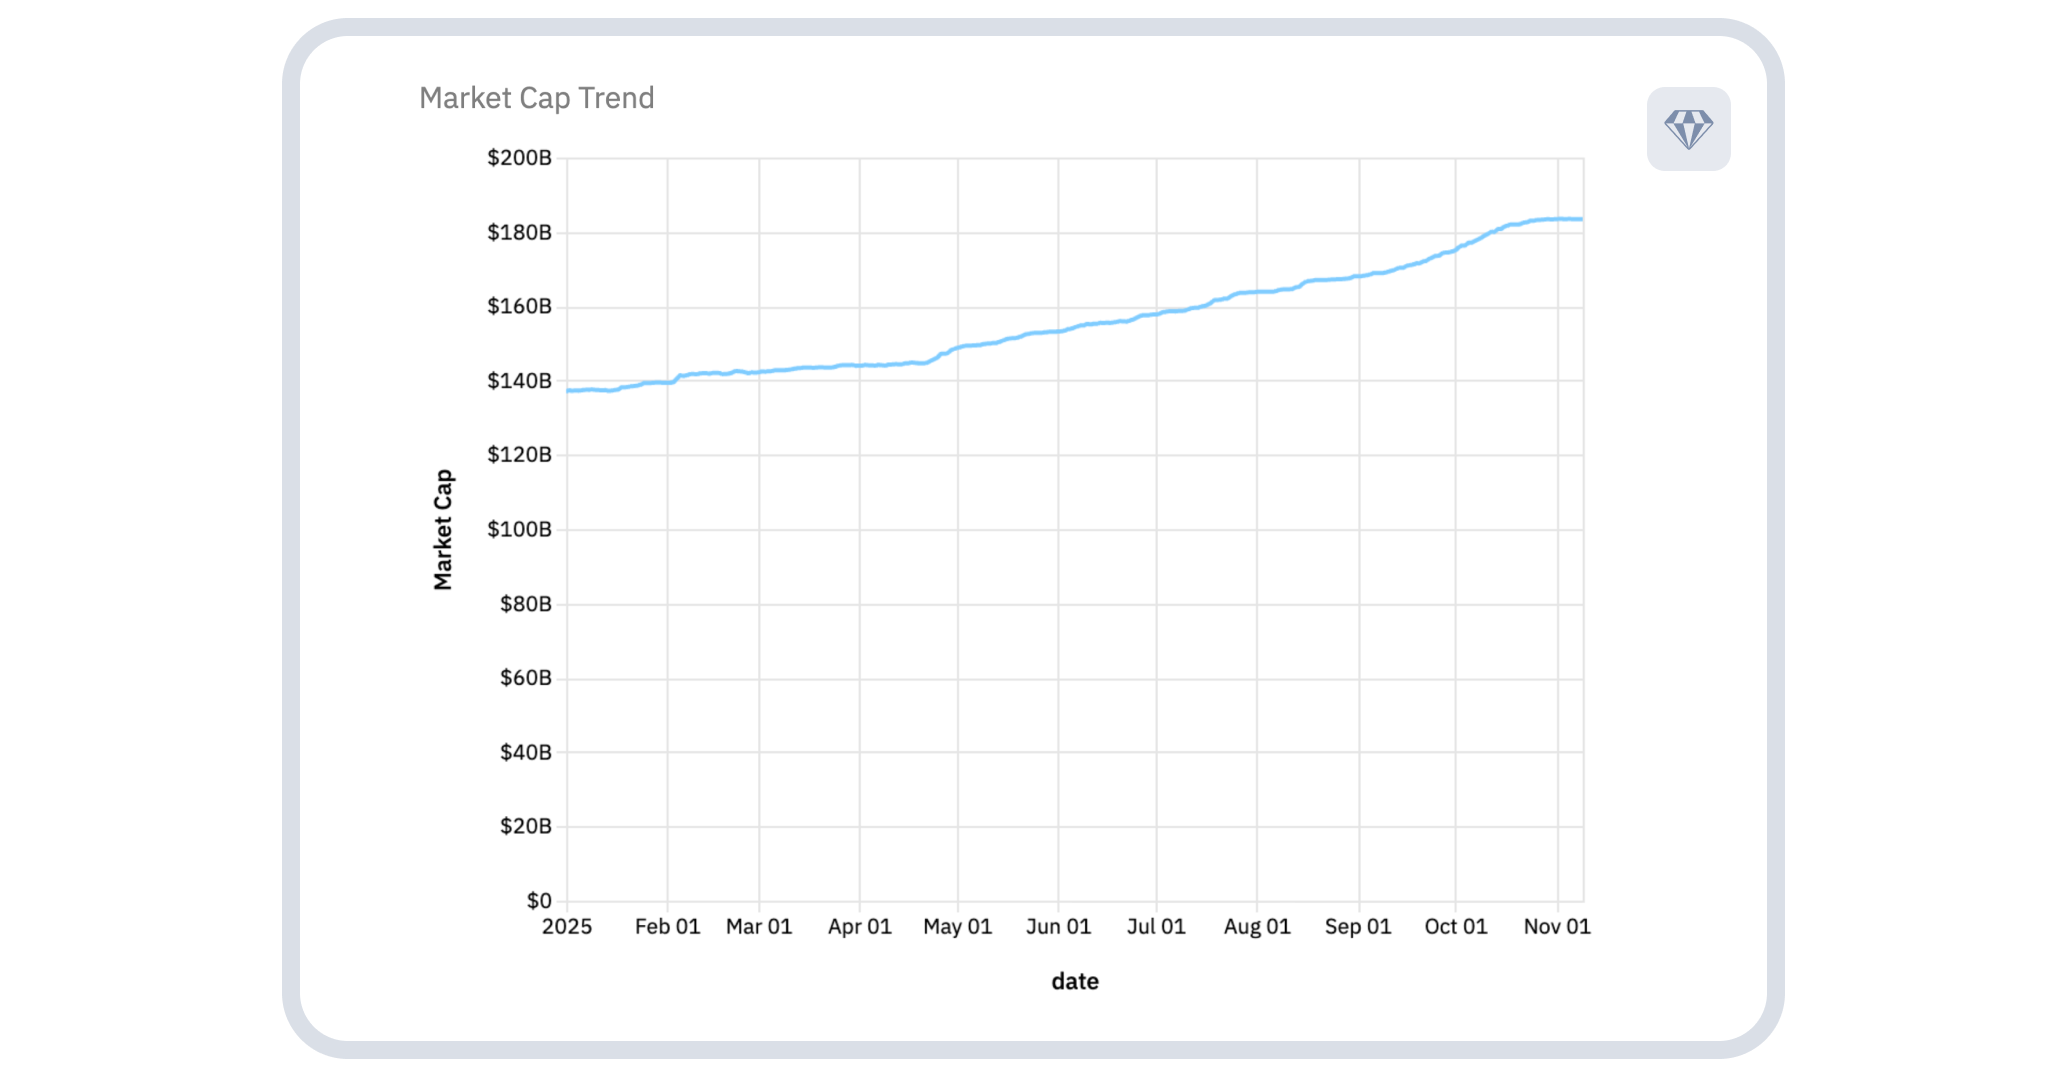
Above: USDT market cap reached $175B by Q3’s end, an increase of 25% from $137B at the beginning of Q1 in 2025.
USDT’s market cap grew steadily during the first three quarters of 2025. It rose from about $140B at the end of January to $175B by the end of September, an increase of $35B, or 25%. Its 2025 trajectory barely fluctuated, suggesting stable demand and controlled supply expansion throughout the northern hemisphere’s summer months.
USDC Market Cap Trend 2025
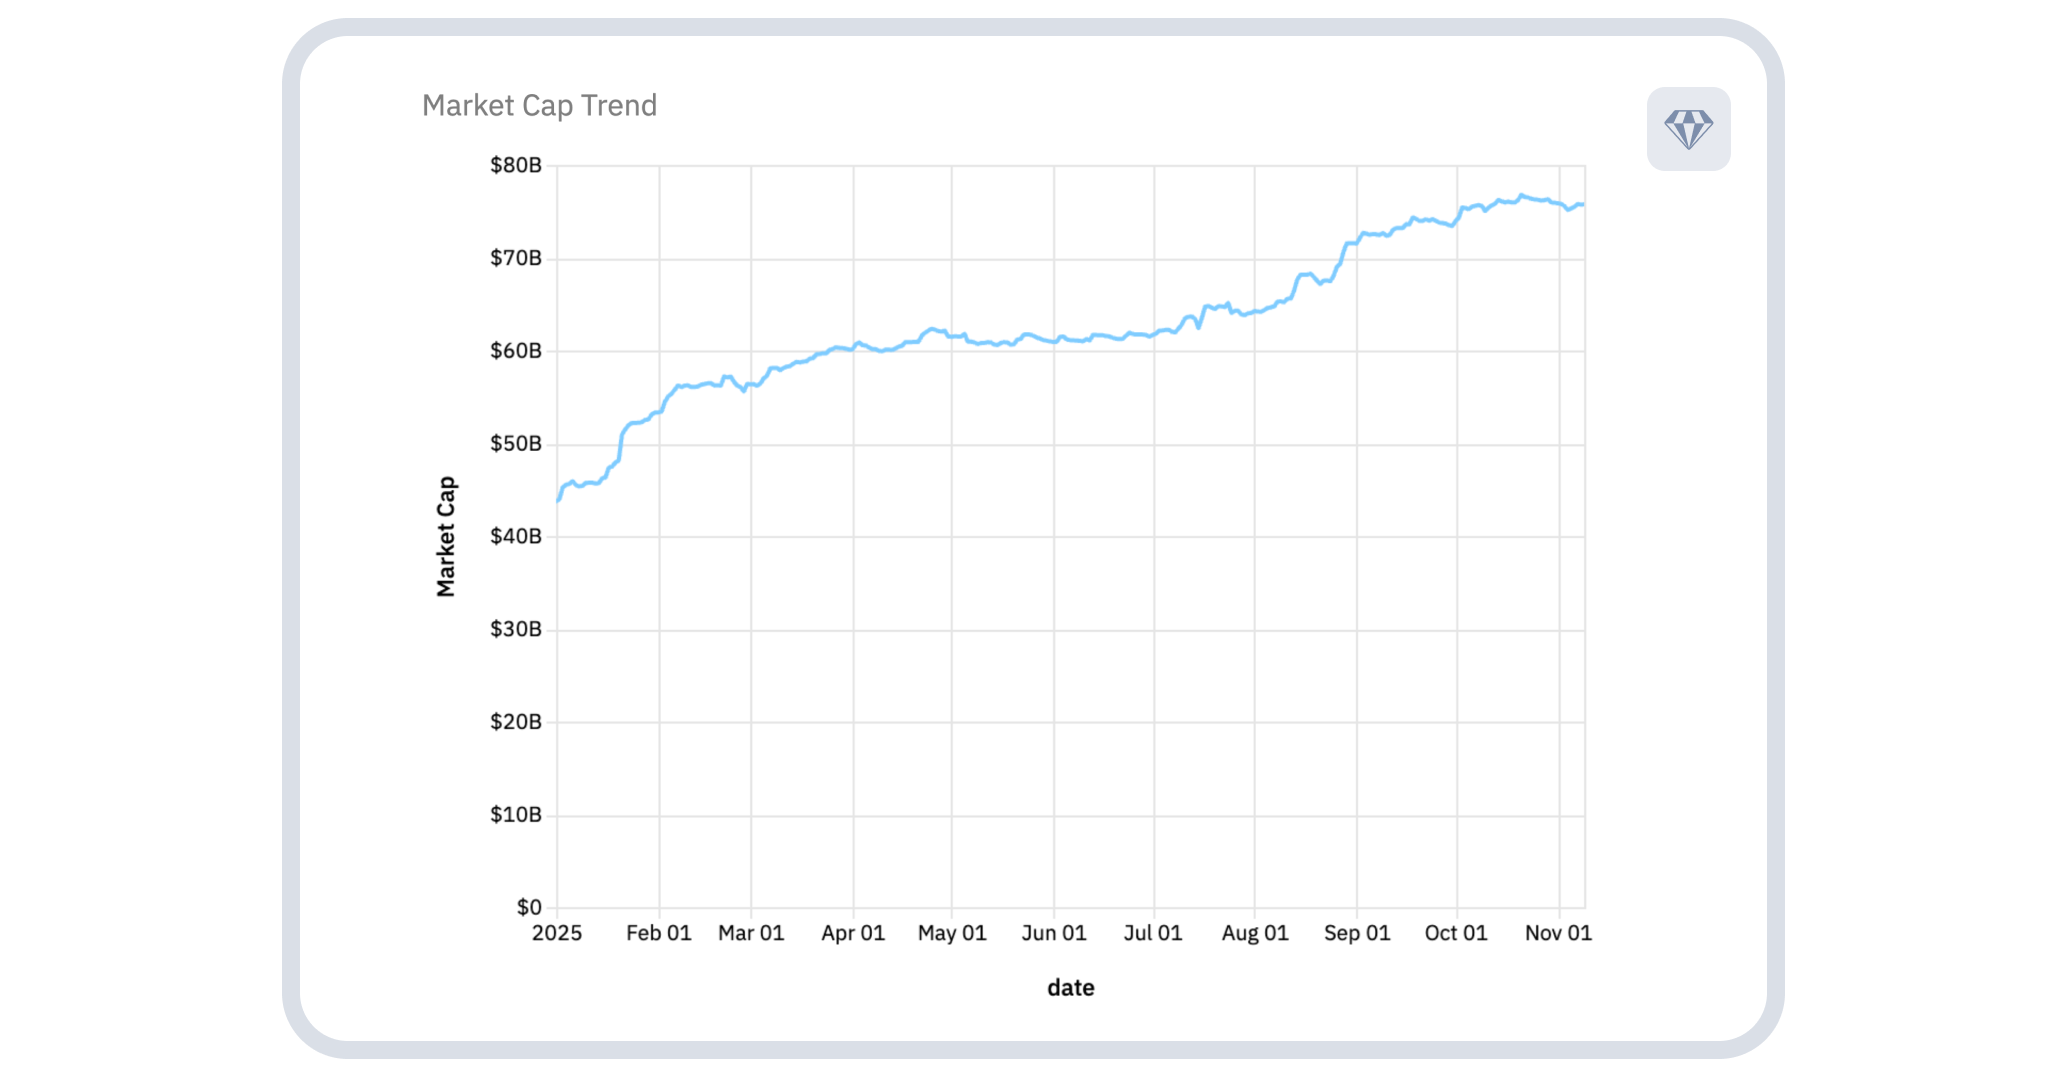
Above: USDC market cap reached $73.4B at Q3’s end from $43.7 at the beginning of Q1, an increase of 68%.
USDC’s 2025 market cap evolution was a roller-coaster ride compared to USDT’s. At the end of January, it was $53.3B, rising to $73.4B at the end of September, an increase of $20.1B, or 37.7%. The spike in mid- to late January (worth about $10B, or a 20% jump) was the first of many peaks and troughs for USDC in 2025.
For example, significant fluctuations were recorded in late February, mid-July, and mid-August, as well as a fall from $74.3B in mid-September to $73.4 at the end of the month/Q3.
However, this apparent volatility has context.
USDC’s dominance in institutional DeFi makes it more widely used by institutional investors, and both the US Treasury (for tokenized projects) and corporate treasuries.
Supporting this position is the correlation of at least some peaks and troughs with the US’s legislative developments concerning digital assets.
The diverging fortunes of the two assets suggest that market participants made active choices about which stablecoin to hold and which to use during the summer period. USDT’s steady climb contrasts sharply with USDC’s spasmodic growth rate, highlighting their distinct roles within the cryptocurrency ecosystem: USDT is favored for its liquidity, while USDC is preferred for institutional adoption.
Trading volume volatility reflects summer market activity
Twenty-four-hour trading volumes for both assets showed varying degrees of volatility during Q3. USDT volumes fluctuated between $40B and $200B, with pronounced spikes in July and August reaching the upper end of this range.
By September, volumes had stabilized at around $140B, suggesting reduced market turbulence as the quarter drew to a close.
USDC trading volumes ranged between $5B and $40B during Q3, varying from one-eighth at the lower end, to one-fifth at the higher end of USDT’s levels. The lower absolute volumes and reduced volatility suggest that USDC serves a more specialized role in market infrastructure, likely concentrated in payment processing and specific trading pairs, rather than providing broad-based liquidity.
The volume patterns reveal a clear preference for liquidity during the third quarter. When markets experienced stress or heightened activity during the summer months, participants turned predominantly to USDT, which maintains deeper order books and tighter spreads across major trading venues.
Transfer volumes of USDT and USDC reveal institutional concentration
Net transfer volume analysis, which eliminates over-counting by netting out intra-day volumes and internal wallet movements, showed that USDT maintained weekly flows between $30B and $50B throughout Q3. The consistency of these volumes during July, August, and September indicates stable institutional demand despite broader market volatility.
USDC transfer volumes ranged between $10B and $25B weekly during the quarter, about one-third of USDT’s activity levels at the lower end, and half at the higher end. The gap between the two assets persisted throughout Q3, suggesting intrinsic differences in how the assets are exploited, rather than seasonal conditions.
Binance emerged as the dominant entity in Q3 transfer flows, processing the largest single-month outflow of $10B in August. Tether Treasury and Circle Pay App also featured prominently, with the latter handling substantial bilateral flows that position it as a critical node in payment processing infrastructure.
The counterparty flow data for Q3 revealed that a small number of entities control most large transfers. Multiple transactions during Q3 exceeded $5B in single movements, underscoring the concentration of stablecoin activity within institutional relationships rather than distributed retail usage.
September burn activity signals supply management differences
Both stablecoins experienced pronounced burning activity in September 2025. USDC showed net burns exceeding $9 billion in a single week during the month. USDT saw burns surpassing $9 billion.
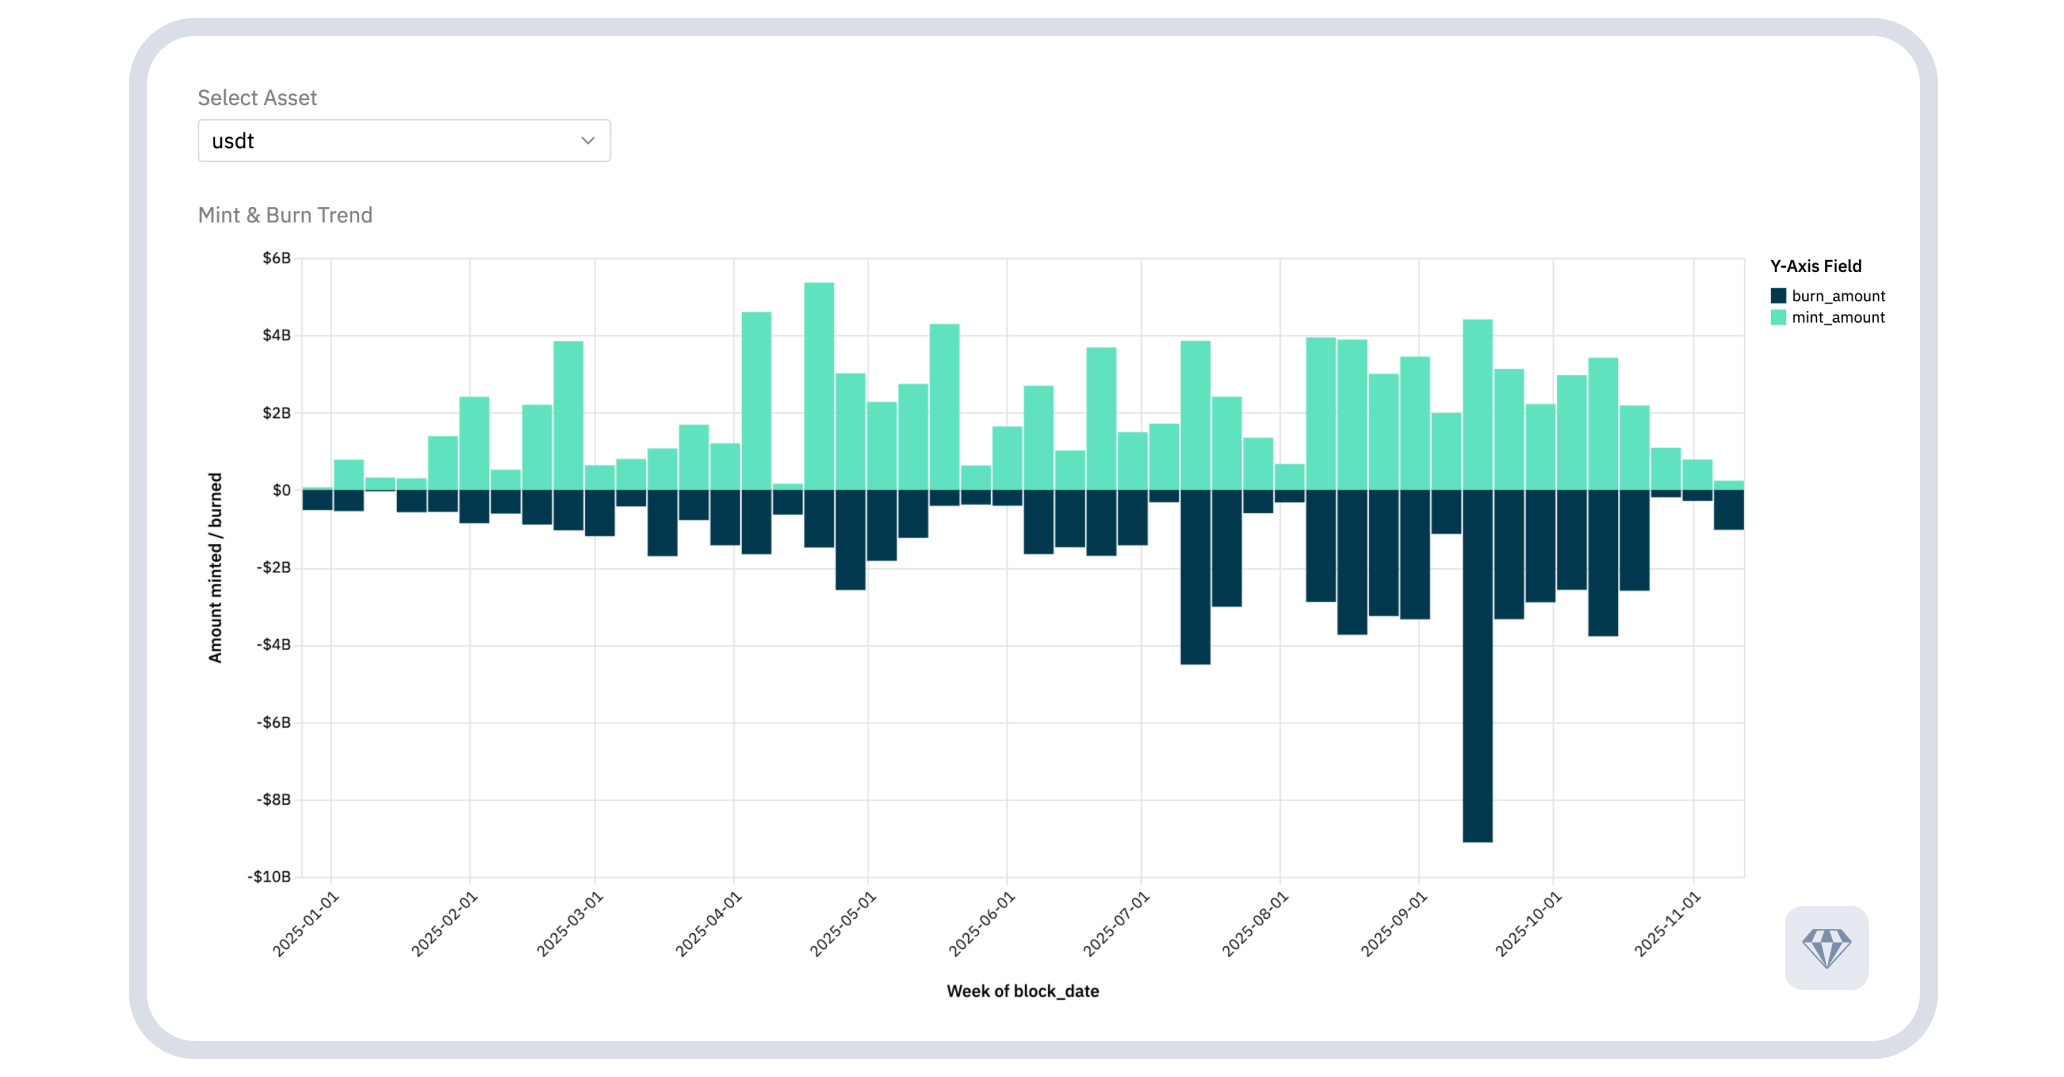
Above: USDT mint and burn pattern 2025.
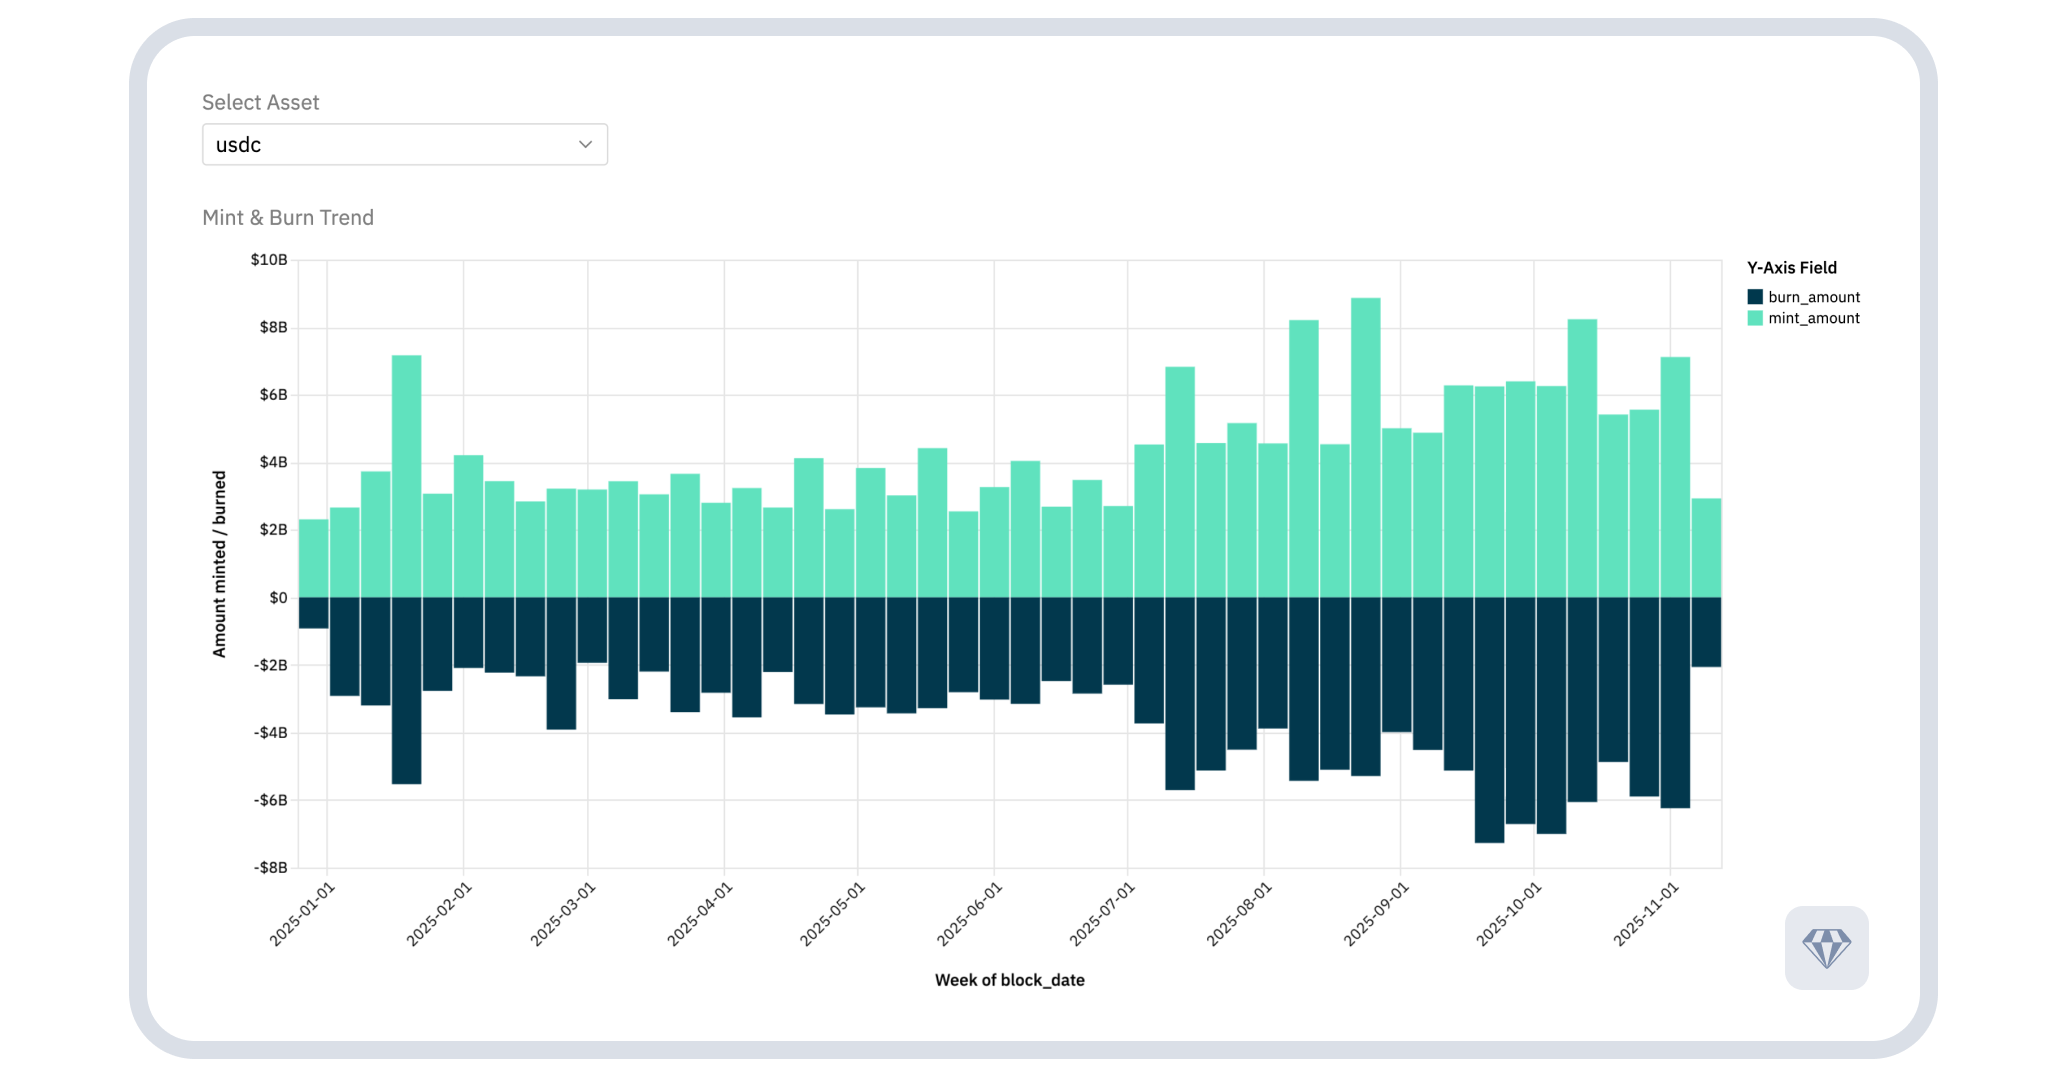
Above: USDC supply dynamics exhibited extreme volatility in September 2025.
Circle Pay App dominated USDT minting operations during the third quarter. The payment processor’s activity ramped up significantly through July and August before the September burn wave began. However, substantial portions of newly minted tokens were simultaneously burned, indicating active circulation management rather than pure supply expansion. For USDT, Bitfinex led minting activity during Q3, with particularly heavy creation in September even as broader burn activity accelerated. The concentration of minting authority within a single exchange during the quarter raises questions about supply distribution mechanisms and potential dependencies on specific platform relationships.
DEX trading shows platform concentration
Decentralized exchange trading for USDT during Q3 concentrated heavily within Uniswap and Fluid, with the two platforms competing for the top spot followed by Ekebo, which processed $25.24 billion across the July-September period. The concentration suggests that deep liquidity pools attract institutional flow seeking minimal slippage during the quarter.
USDC trading showed even bigger concentration during the quarter. Uniswap processed the biggest trading volume in USDC during the three-month period, representing the overwhelming majority of decentralized exchange activity.
The variation in platform preference between token pairs suggests traders selected venues during Q3 based on specific liquidity depth and pair availability rather than uniform platform loyalty. Curve’s dominance in stablecoin trading reflects its specialized design for low-slippage swaps between similar assets.
Intelligence layer distinguishes advanced platforms
While blockchain data provides transaction-level visibility, significant intelligence gaps persist across the stablecoin ecosystem.
Crystal Foresight’s approach differs from conventional analytics platforms by layering entity attribution onto blockchain transactions. Rather than displaying anonymous wallet addresses, the system identifies specific institutions, exchanges, and payment processors behind major movements during the quarter. This attribution enables pattern recognition and risk assessment impossible with basic explorers.
The platform’s net transfer volume calculation addresses a fundamental problem in blockchain analytics: double-counting.
When exchanges moved funds internally between wallets during Q3, conventional tools recorded multiple transactions. Crystal Foresight eliminates double-counting from internal movements and also prevents over-counting by netting out intraday transfers to identify actual position changes accurately. Integration with Crystal Expert allows immediate investigation of anomalous patterns.
When September’s extreme burn activity occurred at the close of Q3, analysts could request custom investigations to determine causes and participants, rather than speculating based on incomplete information. This combination of automated analytics and on-demand human expertise represents a significant advantage over purely algorithmic platforms.
The inclusion of both on-chain blockchain data and off-chain centralized exchange volumes provides comprehensive market visibility. Most pure analytics platforms focus exclusively on blockchain transactions, missing substantial trading activity that occurs within exchange databases. Crystal Foresight combines both datasets, revealing the complete picture of stablecoin flows and usage patterns throughout the quarter.
Market structure implications
The concentration of minting, burning, and transfer activity within a limited set of entities during Q3 creates systemic dependencies that merit attention from market participants and regulators. Payment processors like Circle Pay App have evolved into critical infrastructure, handling substantial minting volumes throughout July and August before the September correction.
The Q3 2025 data suggest stablecoin markets have matured beyond simple growth narratives.
Supply is actively managed in response to market conditions, flows concentrate among major entities, and trading activity consolidates on platforms offering superior liquidity depth. These characteristics indicate an infrastructure layer rather than a speculative asset class.
For USDC, the Q3 market cap decline presents a strategic challenge. While the asset maintains usage in payment and settlement applications, it lost ground to USDT in trading and liquidity provision during the summer months. The September burn activity may represent an attempt to tighten supply and support valuation, though the effectiveness of this approach remains unclear.
USDT’s position appears secure following Q3, supported by superior liquidity, $144 billion in daily trading volumes, and entrenched relationships with major exchanges like Binance and Bitfinex. The asset serves as the primary quote currency for cryptocurrency trading globally, a network effect that proves difficult to displace.
The prevalence of unlabeled addresses in high-value USDC transfers during the quarter suggests that entity identification remains incomplete despite advances in blockchain intelligence. Platforms that can attribute these flows to specific institutions provide material advantages for compliance, risk management, and market surveillance.
Although the September burn activity across both assets suggests coordinated supply management as Q3 closed, blockchain data alone cannot determine the exact cause.
Combined on-chain and off-chain intelligence would be required to attribute causes definitively—a capability that distinguishes advanced intelligence platforms from basic analytics tools.