
Crystal Foresight tracks the $273.5B stablecoin market in real time, covering 99% of all stablecoin assets. Each week, this report highlights what the data shows about supply, transfer activity, and genuine use adoption, so that stablecoin issuers, financial institutions, and regulators can see beyond headline numbers to what is happening on-chain.
Key takeaways
- USDT remains the benchmark for genuine use at scale. Despite reducing its total supply by $995M this week, 63% of its gross transfers are genuine user activity, the highest of any major asset. Net transfer volume grew 2.6% to $4.5B daily.
- USDC and PYUSD are growing their supply by $1.2B and $313M, respectively. But their real user activity tells a different story. Only 13-21% of their transfers this week came from organic transactions.
- Gold-backed PAXG had a strong week, with a 42.6% rise in transfer activity, 69% of which came from genuine users.
- Headline transfer volumes can be misleading. Crystal Foresight data shows that 95% of DAI’s $25B in weekly transfers are the issuer’s own internal operations, not user transactions.
- The organic share metric provides an essential accountability lens. High transfer volumes don’t always mean genuine use. For some assets this week, less than 30% of recorded activity came from real users. The rest was the issuer’s own operations.
The $273.5 billion stablecoin market this week tells two very different stories between headline volume figures and genuine economic usage. For several major assets, between 75% and 95% of recorded transfers are the issuer’s own operations.
Crystal Foresight uses two lenses together. The first is organic share, which is the percentage of gross transfer volume that comes from genuine peer-to-peer activity, as opposed to the issuer’s own operations. The second is net transfer volume, which removes same-day reversals to show only transactions where money actually changed hands and stayed there. Organic share tells you the quality of activity. Net transfer volume tells you the scale of genuine movement. Together, they give a clearer picture than either measure alone.
USDT demonstrated strong performance this week, with 63.5% of its transfers driven by real user activity despite a $995M reduction in supply. Net transfer activity grew 2.6% week-over-week to $4.5B daily. In contrast, DAI posted $6B in gross transfer volume, yet 95% of that came from supply management operations. Only 2.1% represents genuine peer-to-peer activity.
USDC expanded supply by $1.2B but activity registered just 13.4% organic share. The rest reflect issuer operations rather than broad economic usage. Gold-backed assets PAXG and XAUT rose sharply as gold prices climbed, with PAXG achieving 69% organic share dominated by distribution activity.
The overall market recorded a net contraction of $400M. Assets with genuine usage held steady while protocol-heavy assets drove most expansion activity.
Market overview
The 18 assets analyzed hold a combined market cap of $273.5B. USDT retains a commanding 67% market share at $183.5B. USDC holds 27% at $75.2B. The remaining 16 assets together account for roughly 6% of the market.
Daily net transfer volume across all assets totaled $6.8B. USDT accounted for $4.5B of that figure, with 2.6% week-over-week growth. USDC processed $1.2B in daily net transfers, also growing 2.9% week-over-week.
The table below tracks 10 of the 8 assets by market cap, supply change, daily net transfer volume, week-on-week movement, and velocity. Velocity measures the percentage of an asset’s total supply that changes hands each day. A high figure alongside strong, genuine user activity suggests the asset is being used actively for transactions.
Asset | Market cap | Supply change | Daily net transfers | Week-on-week | How active |
USDT | $183.5B | -$995M | $4.52B | +2.6% | High – genuine user activity |
USDC | $75.2B | +$1.22B | $1.23B | +2.9% | Mixed – mostly issuer operations |
USD1 | $4.7B | -$323M | $216M | +27.3% | Rising – worth watching |
DAI | $4.4B | +$14M | $55.8M | -0.5% | Low – 95% issuer operations |
PYUSD | $4.2B | +$313M | $30.5M | -3.2% | Low – supply-driven |
XAUT | $3.0B | $0 | $0 | 0.0% | Minimal –held, not traded |
PAXG | $2.6B | +$61.9M | $46.5M | +42.6% | Strong – gold rally driving use |
RLUSD | $1.5B | +$28M | $25.8M | +14.4% | High – strong genuine activity |
USDE | $49K | -$166M | $41.3M | -39.4% | Falling – sharp decline |
USDS | $97K | +$92M | $50.3M | +65.6% | Low – automated activity |
Several patterns stand out. USDT is contracting supply by nearly $1B while transfer activity grows. USDC is expanding supply by $1.2B. USD1 shows a 27.3% transfer increase against $323M in supply contraction. PAXG leads momentum with 42.6% week-over-week net transfer growth.
How much activity is genuinely user-driven?
Stablecoin volume reporting has a fundamental problem. The industry has no established standard for measuring on-chain activity. Most analyses take gross transfer volume (the total value of all on-chain transactions recorded in a given period) at face value, producing headlines about trillions in stablecoin movement. That figure is meaninglessly inflated. Even when analysts attempt to filter or categorize transfers, the results still fail to clarify what is actually happening on-chain.
Crystal Foresight’s volume fingerprint breaks gross transfer volume down by activity type, separating by supply management operations (mints, burns, treasury movements), protocol-driven activity, and genuine organic peer-to-peer transfers. The percentage of transfers that are genuine user activity is what we call organic share. Net transfer volume removes same-day reversals to show only transactions where funds actually changed hands and stayed there.
This distinction matters for three reasons:
- It separates issuer operational noise from actual adoption.
- It allows accurate comparison across assets of different sizes and structures.
- It provides an accountability measure: when an asset shows high gross volume but low organic share, the question becomes whether users or internal operations are driving activity.
Asset | Daily transfer volume | Organic share | Key insight | Signal |
PAXG | $46.5M NET | 69% | Distribution-driven | Healthy usage |
USDT | $4.52B NET | 63.5% | Genuine settlement | Market leader |
RLUSD | $25.8M NET | 84% | High organic | Undervalued activity |
FDUSD | $2.4M NET | 67% | Strong organic | Small base |
USDC | $1.23B NET | 13.4% | Protocol-heavy | Issuer operations |
PYUSD | $30.5M NET | ~21% | Low organic | Supply-driven growth |
DAI | $55.8M NET | 2.1% | 95% supply mgmt | Protocol recycling |
USDS | $50.3M NET | Minimal | Protocol-dominated | Operational activity |
crvUSD | $5.2M NET | 1.3% | DeFi recycling | Not user-driven |
USDT leads in absolute organic activity. Of its gross volume, 63.5% is organic peer-to-peer activity. In addition, USDT has $4.5B in daily net volume, which represents real, balance-changing movements. No other asset comes close to this figure in absolute terms.
DAI’s $6B gross transfer volume is the most striking example of where gross volume overstates genuine activity. Only 2.1% of transfers represent genuine peer-to-peer activity. The remaining 95% consists of supply management operations. This does not mean DAI is failing, but it does mean that gross volume figures for DAI are not comparable to assets with higher organic shares.
USDC’s 13.4% organic share deserves attention. The asset expanded supply by $1.2B this week, but the low organic percentage suggests this growth reflects operational expansion rather than demand-driven adoption. PYUSD shows a similar pattern with approximately 21% organic share alongside $313M in supply expansion.
RLUSD and FDUSD tell a different story. Both are smaller assets, but organic shares of 84% and 67% respectively suggest a higher proportion of genuine user activity relative to their size.
Market cap: two-week percentage change
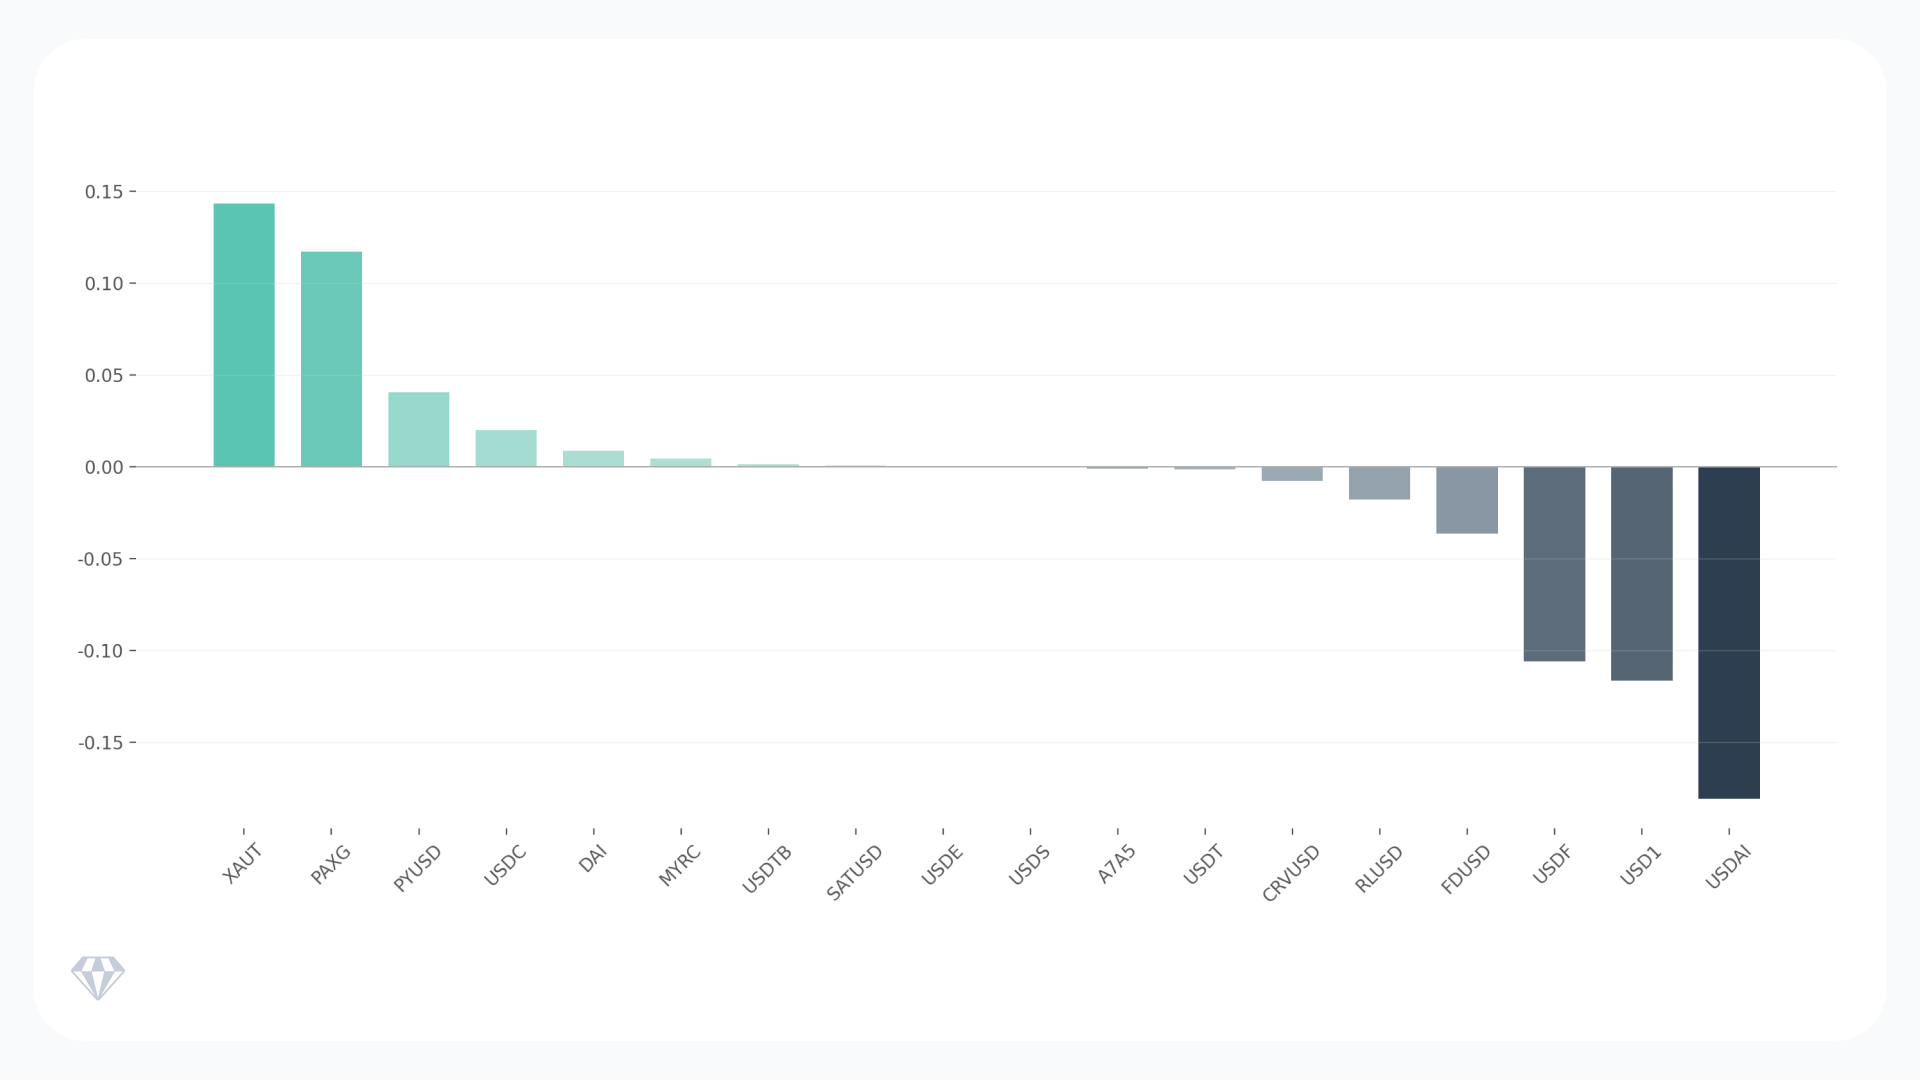
Above: Snapshot of the two-week percentage change. Source. Crystal Foresight
Gold-backed tokens led two-week gains. XAUT rose 14.3% and PAXG gained 11.7%, reflecting the broader precious metals rally. PYUSD advanced 4.1% and USDC added 2.0%. On the negative side, USDAI fell 18.1%, USD1 declined 11.7%, and USDF dropped 10.6%. USDT, the market leader, recorded a negligible 0.1% decline over two weeks.
The 90-day and 365-day data shows deeper structural patterns. PYUSD is up 570% over one year, though from a low base. RLUSD has gained over 1,500% annually, reflecting its recent launch. FDUSD has lost 79% of its market cap year-over-year, indicating sustained contraction in that asset’s role.
Supply dynamics: net contraction of $400M
Where supply grew: $1.7B added
USDC led supply expansion with $1.2B in net minting. PYUSD added $313M. USDS expanded by $92M, PAXG by $62M, and RLUSD by $28M. DAI added a modest $14M. The critical question is whether this expansion corresponds to user demand. USDC’s $1.2B in new supply combined with 13.4% organic share suggests the expansion is operationally driven. PYUSD’s $313M expansion with similarly low organic usage raises the same concern that supply growth is running ahead of actual demand.
Where supply fell: $2.1B
USDT contracted by $995M, the largest single-asset reduction. USD1 shed $323M. USDE lost $166M. USDAI contracted by $34M. USDT’s is notable because it happened while user transfers grew. The asset maintained 63% organic share and grew net transfer volume by 2.6% while reducing supply by nearly $1B. It suggests the issuer is actively managed supply down to match what users need, removing excess coins rather than holding in reserve. USD1’s $323M contraction alongside 27.3% transfer growth creates a divergence worth monitoring. Rising activity with declining supply could mean large holders are cashing out while smaller users remain active.
Signals to watch
Velocity and concentration
Velocity measures the percentage of an asset’s supply that changes hands daily. A high velocity figure alongside a high organic share means the asset is being actively used for real transactions. A high velocity figure alongside a low organic share means most of the activity is automated or internal. In other words, the coins are moving, but not because users are transacting.
PAXG recorded the highest daily net velocity at 3.5%, paired with 69% organic share driven by, genuine user activity, consistent with distribution activity during the gold rally. crvUSD posted 2.5% velocity but with only 1.3% organic share – most of its activity is DeFi protocol recycling, not settlement activity. USDT’s 1.7% velocity with 63% organic share remains the benchmark for consistent, broad-based usage. DAI’s 1.4% velocity appears strong in isolation, but 95% of its transfers are internal issuer operations, which reflects issuer operational intensity rather than users transacting.
The holder concentration data tells a similar story. USDT remains the most distributed asset, with the top 10 wallets holding 27.3% of the supply. USDC follows at 29.8%. Nearly all other assets exceed 80% top-10 concentration: PYUSD at 92.9%, A7A5 at 98.8%, SATUSD at 98.8%, USDAI at 95.7%, and USDS at 93.8%.
Momentum
PAXG leads transfer momentum with 42.6% week-over-week net growth, from $32.6M to $46.5M daily. The 69% organic share confirms this as genuine distribution activity driven by precious metals demand. XAUT, the other gold-backed token, gained 14.3% in market cap over two weeks but shows minimal transfer activity, suggesting investors are holding rather than transacting.
USDS posted 65.6% week-over-week transfer growth to $50.3M daily. This growth occurs with minimal organic share and 93.8% top-10 concentration. Ordinarily, this would indicate protocol-driven expansion among a small number of holders rather than broad adoption. However, 68.6% of USDS supply is held in the official staking contract for USDS yield generation. This likely reflects users staking USDS for yield rather than concerning concentration.
FDUSD showed a 232% transfer spike, but from a small base of $733,000 to $2.4M daily. Its 67% organic share at this scale makes the percentage figure less significant in absolute terms.
USDAI presents the opposite signal. Transfer volume collapsed 84.5% week-over-week, from $28.6 million to $4.4 million daily. Combined with 95.7% top-10 concentration and 18.1% market cap decline over two weeks, this suggests concentrated withdrawal of activity from a narrow holder base.
Risks
Volume quality
Major stablecoins showing 75% to 95% of transfer volumes are internal issuer operations, headline volume figures can give a misleading picture of genuine adoption. DAI, USDC, USDS, and PYUSD all fall into this category. For institutions using transfer volume to assess which stablecoins have real liquidity and market depth, Crystal Foresight’s organic share data gives a clearer view.
Concentration risk
Multiple mid-cap assets show more than 95% of supply held by the top 10 wallets. For SATUSD, A7A5, and USDE that level of concentration means a small number fo large holders can move markets significantly – a risk worth factoring in for institutions seeking stablecoin exposure beyond USDT and USDC.
Velocity without adoption
DAI’s 1.4% velocity despite 95% supply management dominance is a reminder that velocity alone does not confirm user adoption. When paired with low organic share, it indicates issuer operational intensity. This pattern could spread to other DeFi-native stablecoins.
Supply-activity divergence
Will USDC’s organic share improve as supply stabilizes, or continue declining with operational expansion? Can USDT maintain 60%+ organic share if supply contraction accelerates? Do gold-backed tokens sustain distribution-driven growth beyond the current precious metals rally?
These are the key questions Crystal Foresight will track in the weeks ahead.