
Key takeaways
Only 22% of $1.77 trillion in weekly stablecoin volume is real money movement. The remaining $1.37 trillion is lending collateral, DEX liquidity, use cycling, and supply mechanics. Analysis based on gross volume alone overstates real use by roughly five times.
The three largest dollar stablecoins now serve three different markets. USDT is primarily a payment asset (37% peer-to-peer). USDC is primarily exchange infrastructure (59% DEX liquidity). USDS is primarily collateral (82% collateral flow). Market capitalization alone does not convey these differences.
USDT’s organic share fell 9.2 percentage points to 44.0%, even as gross volume grew 22.8%. The increase came from DeFi activity, not payment users. USDT remains the healthiest large-cap profile, but the trajectory is flattening.
USDS supply expanded by $345.93 million while organic share fell to 1.2%. Market cap is growing decoupled from payment demand, raising questions about what the circulating supply is supporting beyond lending infrastructure.
Market snapshot
For the week ending April 20, 2026, stablecoin issuers and analysts can point to $1.77 trillion in weekly gross transfer volume across 29 tracked assets. That number is accurate. It is also misleading.
Of that total, only $393 billion, or 22%, represents real money movement between users or businesses. The remaining $1.37 trillion is lending collateral, decentralized exchange liquidity, use cycling, and internal issuance mechanics. These are legitimate on-chain activities. They are not payment adoption.
That gap matters because the three largest dollar stablecoins have now specialized into three separate functions. USDT is primarily a payment asset. USDC is primarily a decentralized exchange infrastructure. USDS is primarily collateral. They sit in the same market cap ranking, but they do not do the same job.
Crystal Foresight tracks this composition weekly. The analysis separates what we call organic share, which is genuine money usage including peer-to-peer settlement and real-world payments, from financialized volume, exchange flow, and supply mechanics. The distinction reshapes how any reader should interpret headline volume figures.
How to read the composition, not the total
Gross transfer volume counts every stablecoin transaction on the underlying blockchains. It does not distinguish a user sending $100 to a merchant from a smart contract re-posting $100 of collateral. Both show up in the same number.
Crystal Foresight splits weekly volume into four categories. Organic volume covers peer-to-peer transfers and real-world settlement, the activity that matches any intuitive definition of money use. Exchange flow captures deposits to and withdrawals from centralized exchanges. Financialized volume covers DeFi mechanics, including DEX swaps, yield-protocol activity, use cycling, and collateral movements in lending. Supply mechanics covers issuance, redemption, and cross-chain bridging.
The average organic share across tracked assets this week was 21.2%. That figure alone tells the reader that more than three-quarters of reported stablecoin activity is infrastructure, not payment. It also tells the reader that any analysis based on gross volume alone will overstate real use by a factor of roughly five.
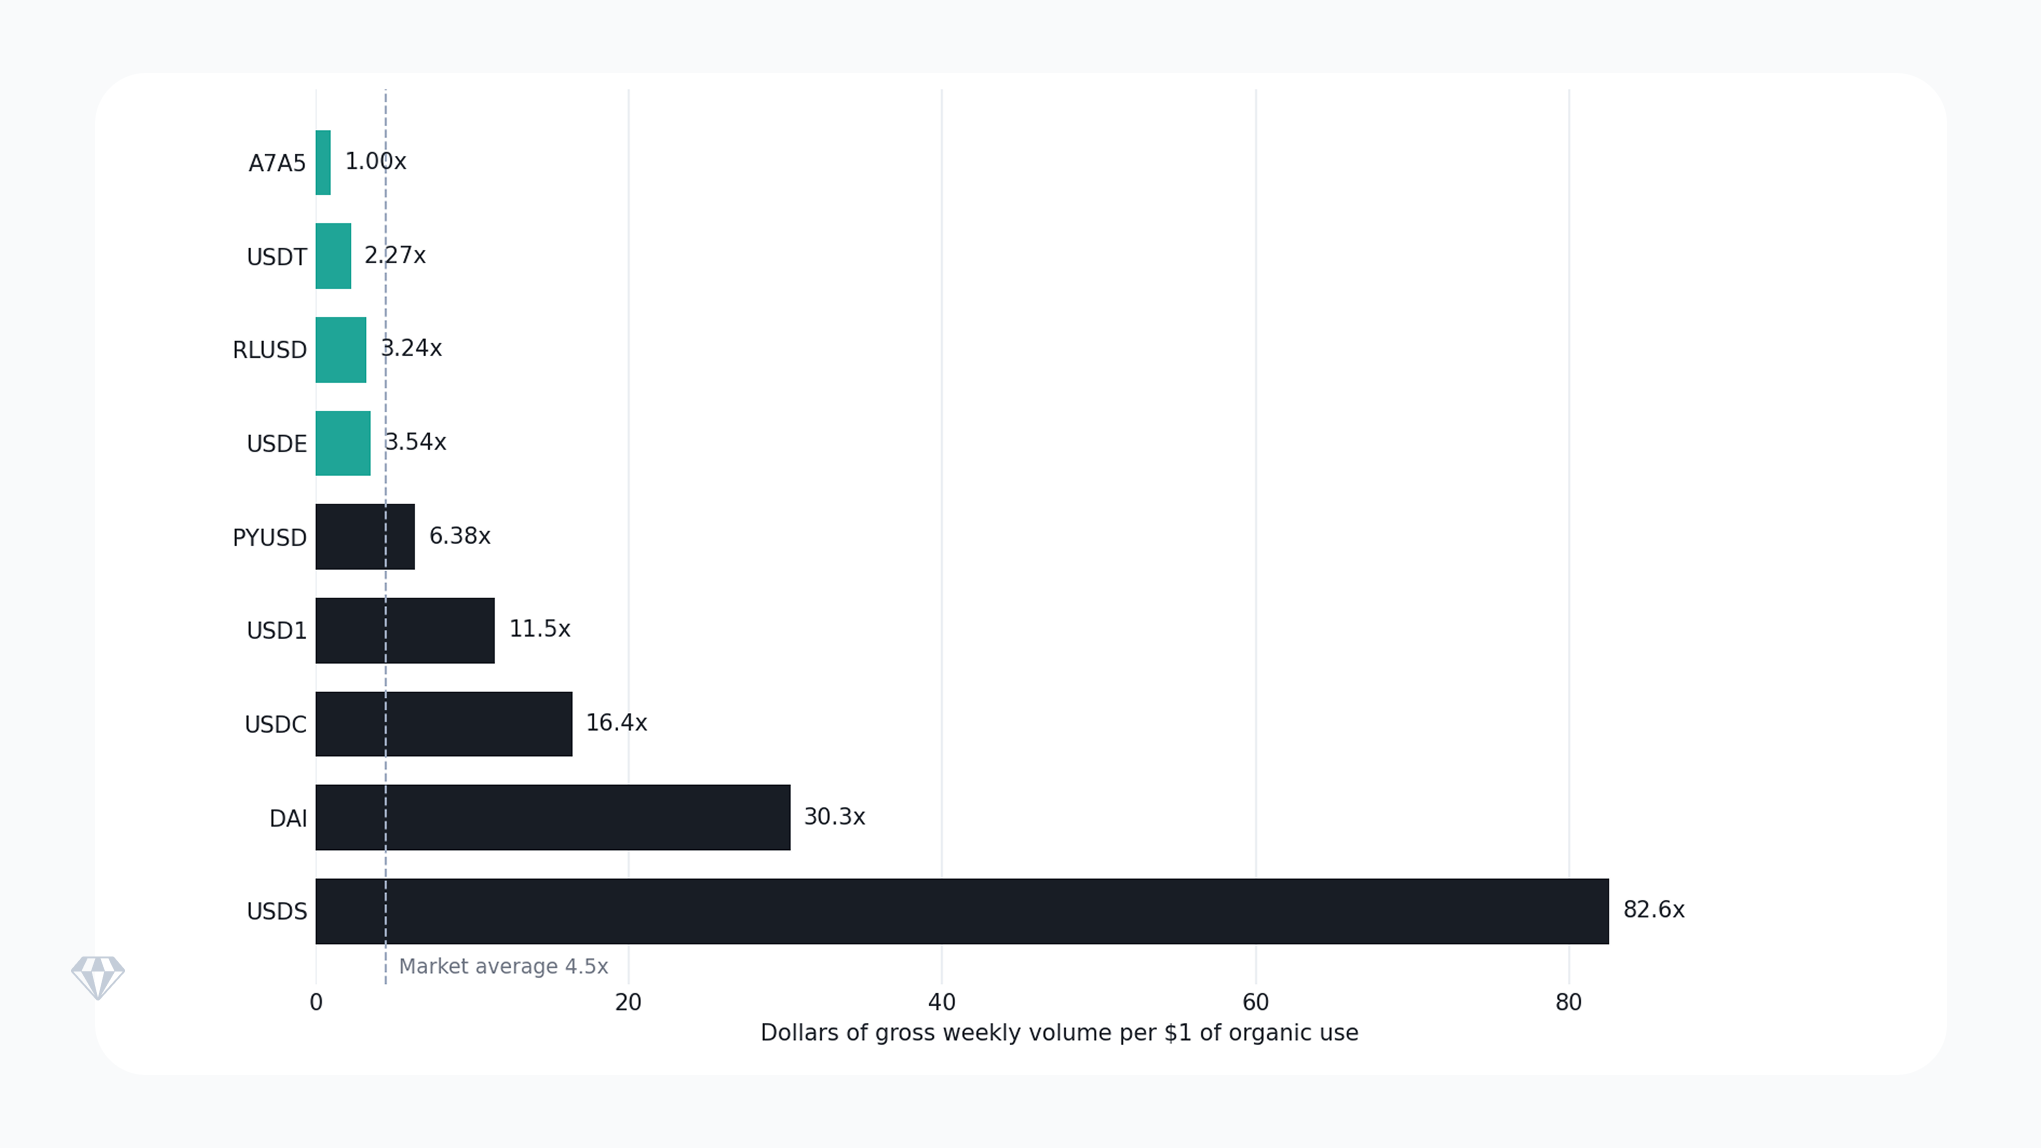
Above: Weekly gross transfer volume per $1 of organic use. Teal bars are below the market-wide ratio of 4.5x; dark bars are above it. Source: Crystal Foresight, week ending April 20, 2026.
USDT still pays, but its quality is slipping
USDT ended the week with $187.26 billion in market capitalization, or 61% of the total stablecoin market by dollar value. Its weekly gross volume was $374.98 billion, and of that, $165.10 billion was organic. That is more real money movement than every other large-cap stablecoin combined.
The dominant archetype for USDT is peer-to-peer transfer, which accounts for 37% of volume. Exchange flow accounts for 23%, financialized volume for 30%, and supply mechanics for 3%. This is the profile of an asset being used to send and receive value, not only to post collateral or swap on decentralized exchanges.
However, USDT’s organic share fell 9.2 percentage points week-over-week, from 53.2% to 44.0%. Gross volume expanded 22.8% in the same window. The combination of more total volume and a lower-quality mix means the increase came from DeFi activity rather than from payment users. USDT supply also expanded by $485.37 million, roughly to line with its organic usage. This remains the healthiest profile among the large caps, but the trajectory is flattening.
USDC isn’t being spent; it’s being traded
USDC processed $1.29 trillion in weekly gross volume this week, the largest number of any stablecoin. Of that, only $78.47 billion, or 6.1%, was organic. Its dominant archetype is DEX liquidity, which accounts for 59% of volume. Collateral flow, use cycling, and yield protocol activity together add most of the remainder.
The composition is decisive. 89% of USDC volume is financialized, 3% is exchange flow, 6% is organic, and 2% is supply mechanics. USDC is not primarily a payment stablecoin in the current market. It is the unit of account for decentralized exchange activity and on-chain collateral posting. Its $78 billion in weekly organic volume is not small in absolute terms, but relative to its $1.29 trillion gross figure, it is a minority of total activity.
USDC supply contracted by $50.12 million this week, roughly in line with its scale, suggesting supply management matches activity rather than outpacing it. The data does not support treating USDC and USDT as equivalent categories. They are now largely in different businesses.
USDS is mostly collateral, not currency
USDS has a market cap of $10.72 billion, placing it third in the large-cap tier. Its weekly gross volume of $18.25 billion would, at first reading, suggest meaningful circulation. The composition tells a different story. Most of the supply doesn’t circulate at all, with the majority sitting in the SUSDS savings contract. What does ” Move ” tell a similarly concentrated story?
Of that $18.25 billion, 93% was financialized. Collateral flow alone accounted for 82%, the highest concentration in any tracked asset. Only 1.2% of USDS volume, or $220.79 million, was organic. That is a ratio of roughly $83 of reported volume for every $1 of real use.
This would be notable as a snapshot. What makes it structural is the supply side. USDS supply expanded by $345.93 million this week, even as the organic share fell 1.1 points week-over-week. The issuer is minting additional circulation at scale for an asset that is increasingly being used only to post and release lending positions. Market cap is growing decoupled from payment demand.
The accountability question this raises is direct: what is the circulating supply of USDS supporting, if not payments? The current answer is lending infrastructure. Whether that answer is sustainable is a separate question for risk officers who depend on USDS for collateral.
The three large caps, side by side
A single table makes the divergence clear.
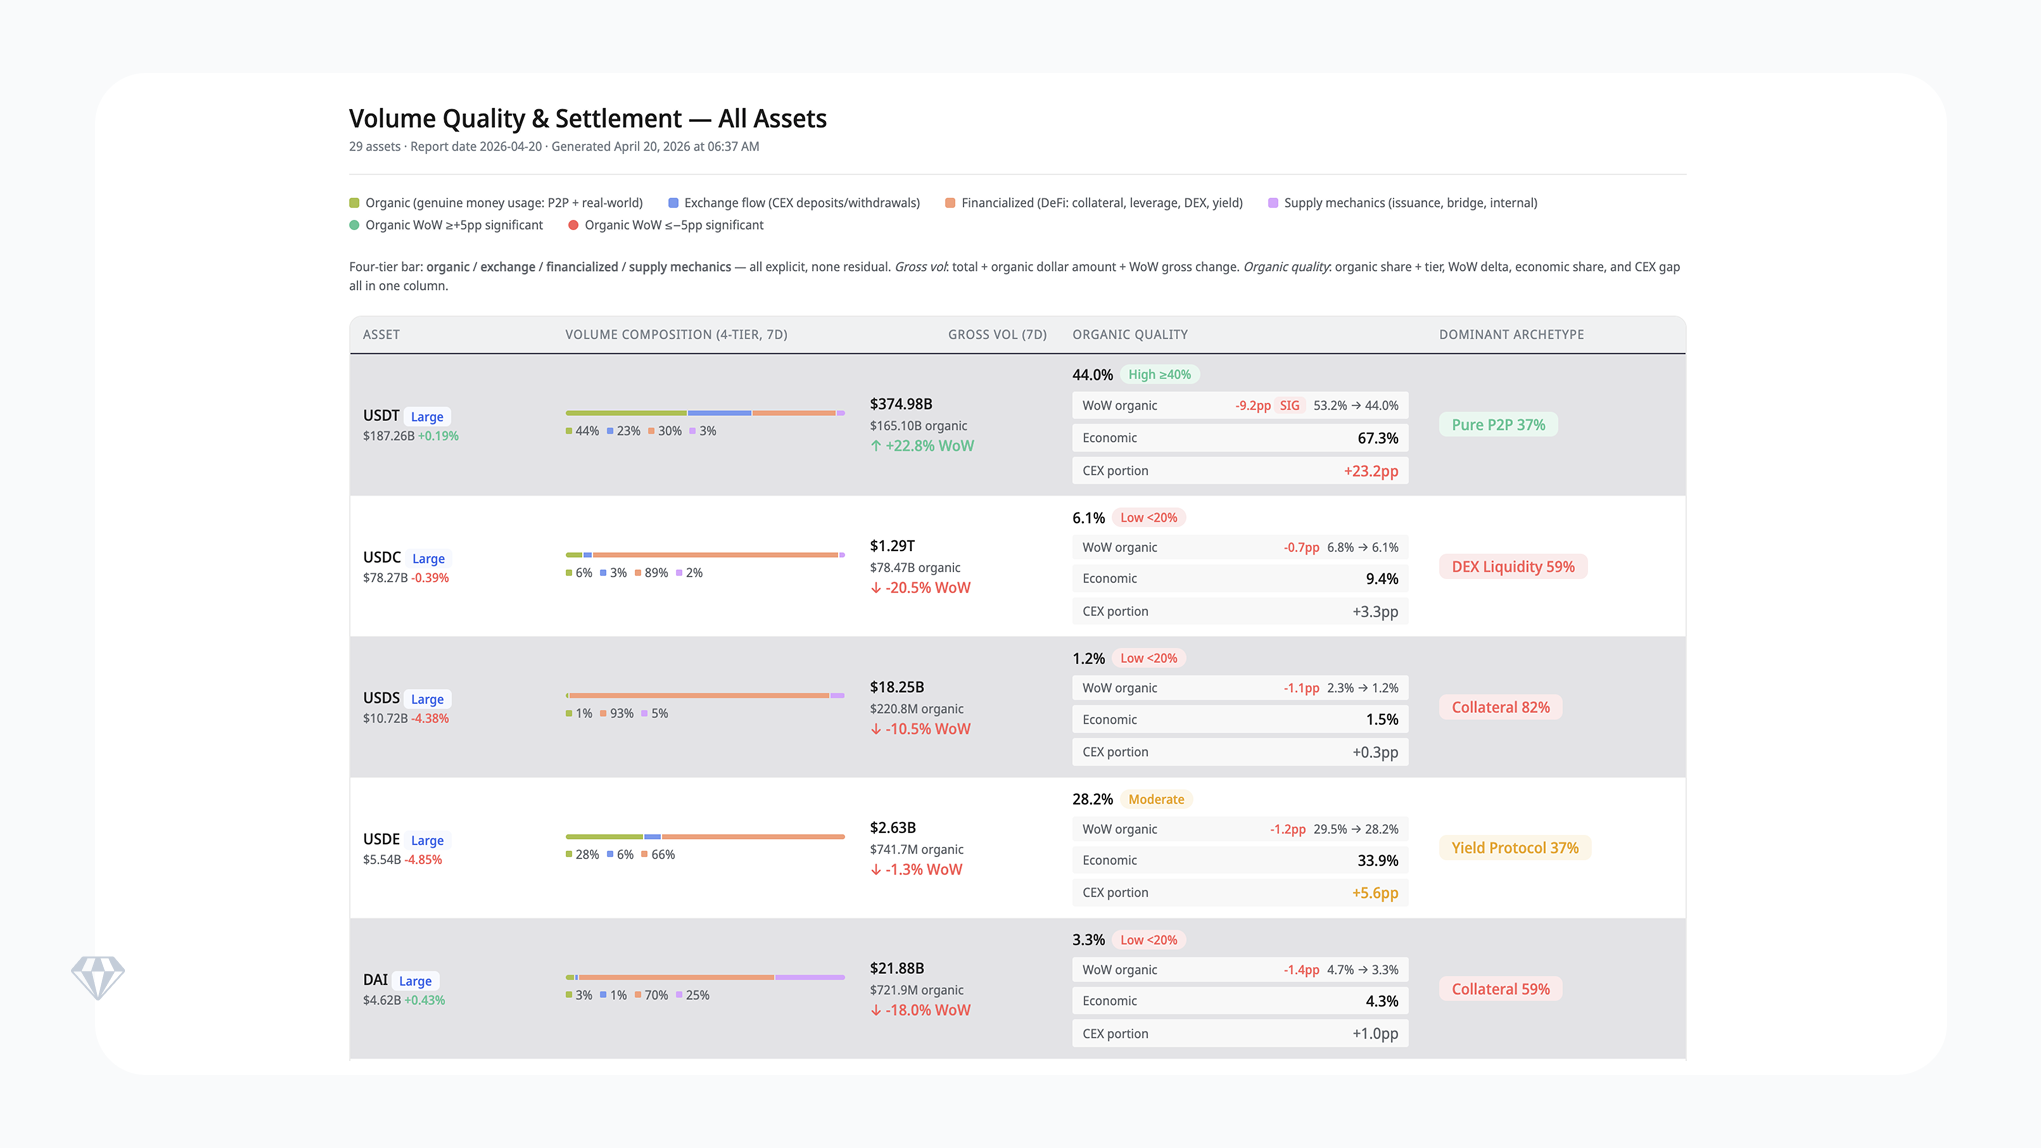
Above: Volume composition for the three large-cap dollar stablecoins. Source: Crystal Foresight, week ending April 20, 2026
Read by market cap, the three look like direct competitors within the same stablecoin category. Read by composition, they serve three different markets. A compliance team assessing exposure, a treasurer allocating balance sheet, or a regulator weighing systemic risk would reach different conclusions from each metric.
Signals to watch
Two smaller-cap stories are worth flagging. RLUSD, at $1.42 billion in market cap, combined a 30.8% organic share with a 13.18% daily net transfer velocity this week, the highest among large-cap assets. Its organic share rose 3.3 points week-over-week. This combination, high velocity paired with high organic quality, is rare and indicates real circulation among users rather than mechanical turnover. A7A5, a mid-cap asset, maintained a 99.9% organic share even as its weekly gross volume fell 84.5%. The volume compressed, but the portion that remained was almost entirely peer-to-peer.
Two cautionary patterns also appeared. USDTB posted weekly gross volume growth of 1,119.8% while its organic share fell 28.4 points to 14.1%. This is the textbook signature of DeFi activity, inflating the headline number. PYUSD’s organic share dropped 10 points to 15.7% even as its supply expanded by $56 million, a smaller version of the USDS pattern.
Small-base swings should not distract. EURS posted a 1,985% net transfer acceleration on a current seven-day average of $28,380. The percentage is real. It describes statistical noise, not a market movement.
Risks and open questions
Organic share volatility across the top three. USDT’s 9.2-point drop in organic share is the largest single-week decline in the dataset for any asset above $100 billion. If DeFi-driven volume continues to grow faster than payment usage, the organic share trajectory could fall below 40% within weeks. That would not change USDT’s dominance in absolute organic terms, but it would narrow the quality gap between USDT and assets with structurally lower organic profiles.
Supply growth decoupled from usage. USDS expanded supply by $345.93 million while organic volume accounted for just 1.2% of its total. PYUSD expanded by $56 million while the organic share fell 10 points. When issuers mint at scale without corresponding transfer activity, the question of what supports the circulating supply becomes a risk management concern, not just an analytical observation.
Gross volume is a misleading benchmark. USDC processed $1.29 trillion in weekly gross volume, the highest of any stablecoin, yet only 6.1% was organic. Any counterparty, regulator, or analyst relying on gross volume to assess USDC’s role as a payment instrument would materially overstate its function in that category.
Three questions frame the week ahead. Will USDT’s organic share stabilize above 40%, or does the DeFi-driven expansion continue to erode quality? Can RLUSD sustain its combination of high velocity and high organic share as it scales past $1.5 billion? Does USDS supply growth generate any measurable organic activity, or does the decoupling deepen further?
What this week’s data adds up to
The central observation is not about which stablecoin grew fastest or fell hardest. It is that the three largest dollar stablecoins now occupy three distinct roles. USDT remains the closest instrument to a payment stablecoin at scale. USDC functions as on-chain exchange infrastructure. USDS functions as a collateral instrument. Market capitalization alone does not convey these differences. Composition does.
For any party monitoring stablecoin exposure, compliance teams, treasurers, regulators, or counterparties, the practical lesson is straightforward. Gross weekly volume overstates real use by a factor of about five across the market, and by substantially more for individual assets. Organic share and volume composition are the signals to track. Headline totals are not.