
An analysis of crypto transactions made by crypto-criminals post-theft between 2015 and 2025, with a look at how fund flow patterns have evolved from single-chain obfuscation to cross-chain bridge-based withdrawal strategies.
Key findings
- Withdrawal timelines have compressed dramatically. In 2015, criminals held stolen funds for up to 365 days. By 2020, the average was 28 days. Post-2022, cross-chain bridges have further compressed this, with funds sometimes distributed across multiple blockchains within hours.
- Cross-chain bridges are now the dominant withdrawal method. Since 2022, criminals have increasingly moved stolen funds through bridge protocols rather than relying on single-chain obfuscation. Over 75 bridge protocols are now in common use across major blockchains.
- Mixer usage has evolved, not disappeared. After enforcement actions against services like Tornado Cash, criminals shifted to alternative mixers and often combine mixing with cross-chain movement for additional obfuscation.
- Exchange routing has shifted. In 2015, 53% of stolen funds went to exchanges with verification requirements. By 2020, that dropped to 8%, with mixers and unverified exchanges absorbing the majority.
- Hop patterns now span multiple blockchains. Between 2015 and 2020, 81% of withdrawal transfers used nine or fewer hops on a single chain. Today, many hop sequences cross three or four chains via bridge transactions.
- The investigative capability gap is narrowing. Automated cross-chain tracing now covers the majority of swap operations across major blockchains, compared to entirely manual reconstruction five years ago.
- Off-chain intelligence adds a new dimension. Victim-reported scam data is increasingly available to complement on-chain analysis, enriching stolen fund tracing with real-world context.
When crypto assets are stolen, the clock starts immediately. Criminals need to move funds away from identifiable addresses and toward exit points where they can convert to fiat currency or obscure the trail. Understanding how stolen funds move through blockchain networks is essential for investigators, compliance teams, and law enforcement agencies working to recover assets and hold bad actors accountable.
Our research team has analyzed withdrawal and transfer patterns of stolen crypto assets across data spanning 2015 to 2025. This analysis examines the routes criminals take after a theft, how quickly they act, and how their methods have evolved. The original analysis (published in 2021) focused on Bitcoin-based withdrawal paths using 2015–2020 data. This update extends the research to cover the post-2022 landscape, where cross-chain transfers via bridge protocols have become a dominant withdrawal strategy.
The Crystal team analyzed all entities on the Bitcoin Blockchain that have been reportedly connected to ransom, scams and/or theft since 2015. These entities are referred to as crypto-criminals for the purposes of this report. The report examined the average time required to transfer stolen funds, as well as the share of stolen funds transferred to known entities by year and by “hop”.
Average transfer times of stolen funds to known entities 2015-2020
The graph below shows the average time required for crypto-criminals to withdraw 80% of the stolen funds and to get them out of their addresses.
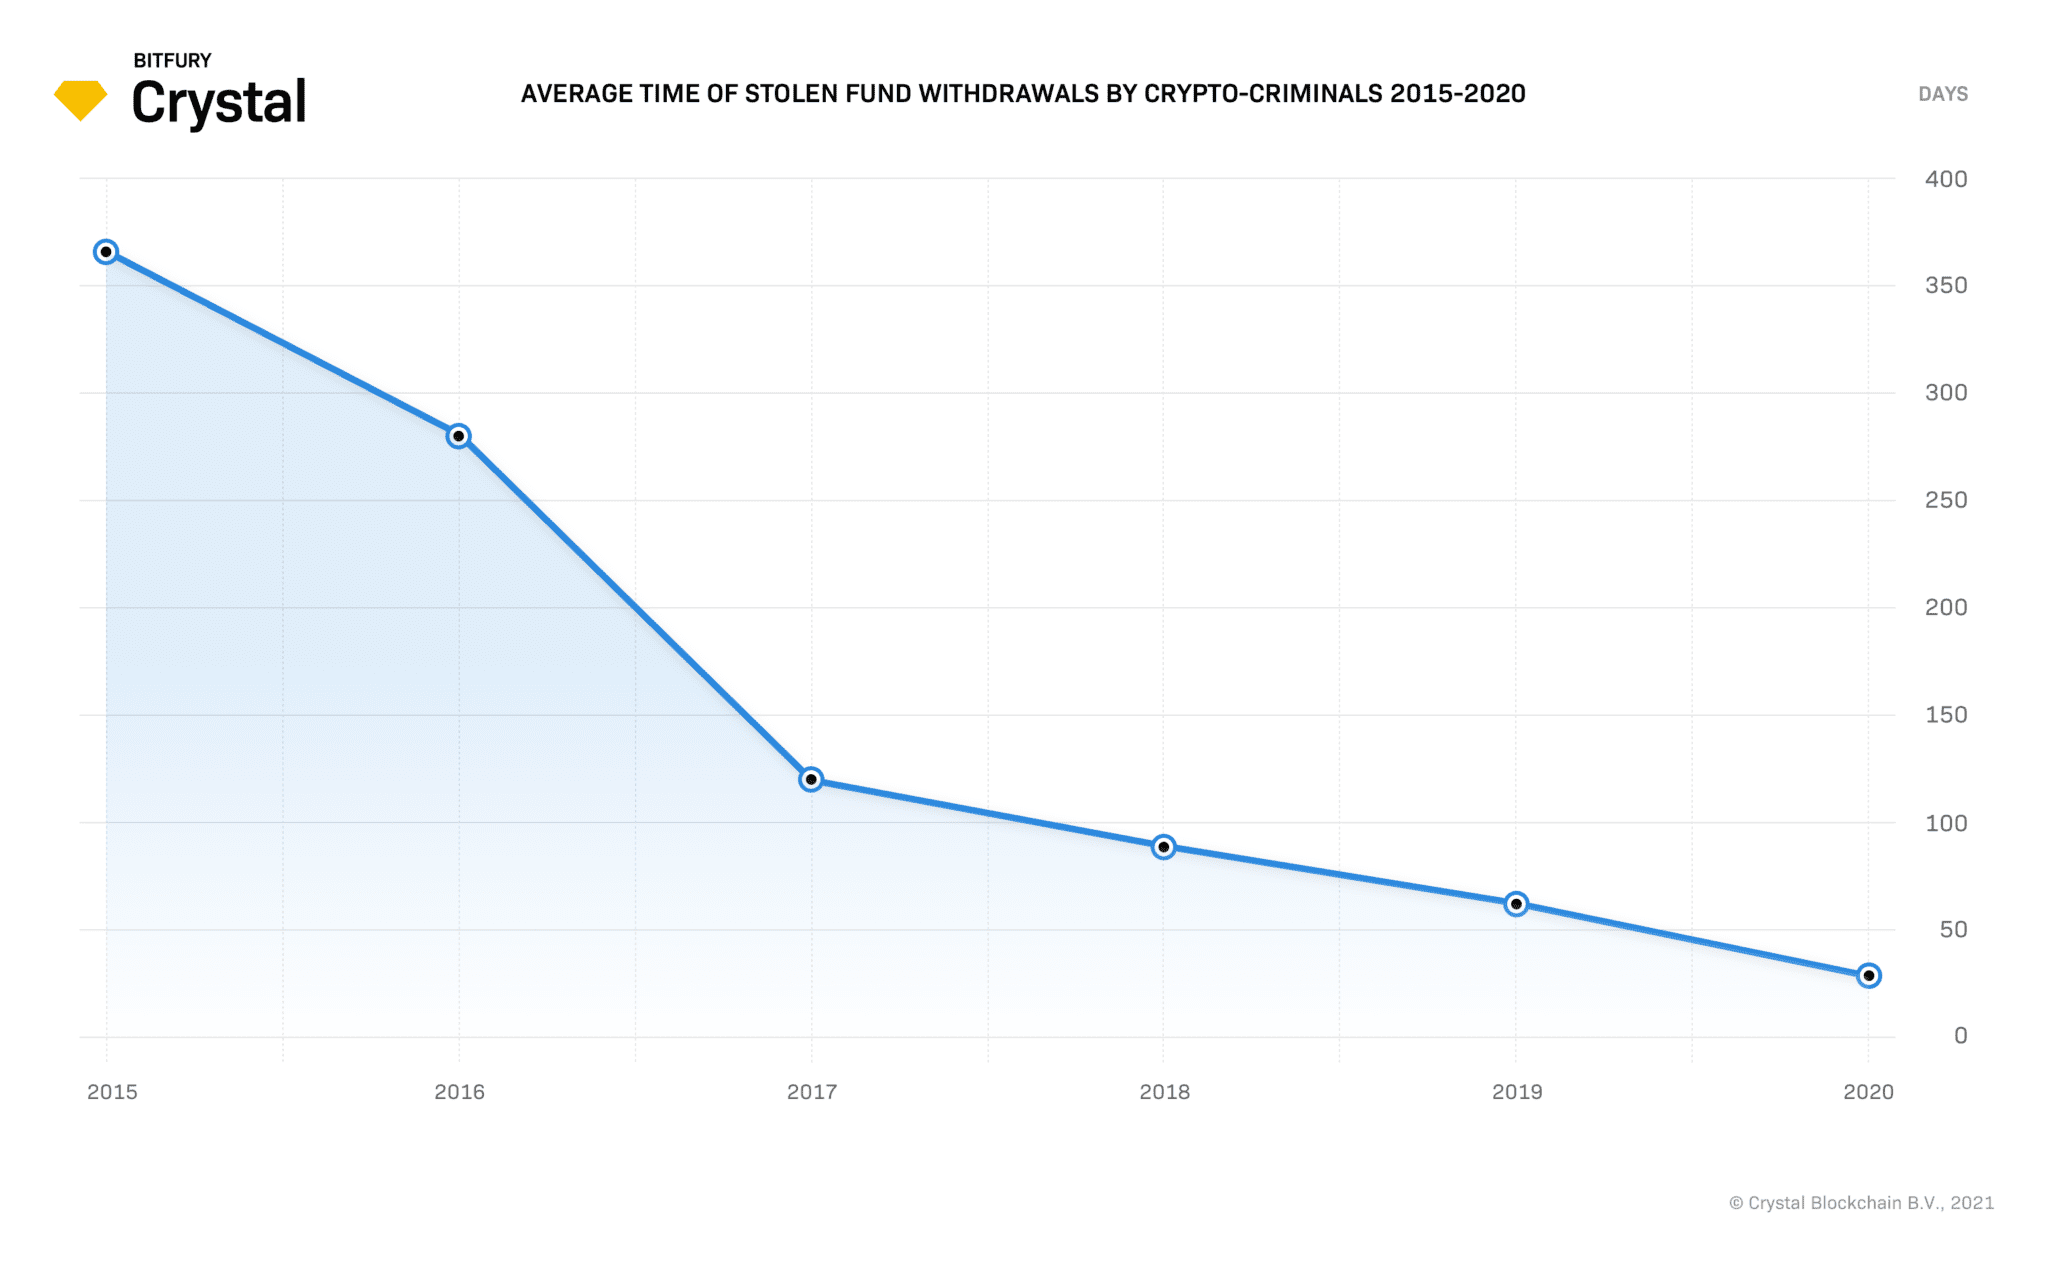
According to Vilfredo Pareto’s Pareto Principle, also known as the 80/20 rule, 80% of the consequences of any action come from 20% of the causes. Following this principle fairly accurately, 80% of the funds stolen by crypto-criminals are often found to be withdrawn as quickly as they think best, while the other 20% may remain in the balance for much longer after the illicit activity has been completed.
For this reason, we chose to analyze the withdrawal time for 80% of the amounts received by each crypto-criminal. (NOTE: These parameters only apply to the graph above. The subsequent graphs below were calculated using 100% of fund flow/transaction volumes.)
The first thing to note is that the average withdrawal time for 80% of the stolen funds has steadily reduced over the last five years. While in 2015 crypto-criminals could hold stolen funds for up to 365 days, in 2020, the average time for withdrawing 80% of the illicitly gained funds is around 28 days. This is a 13X decrease in withdrawal times from 2015 to 2020.
Some of the potential reasons for such changes are:
- The development of crypto networks that include various VASPs and law enforcement entities, and
- The growing popularity of blockchain analysis tools.
In the case of security breaches, for example, the combination of the speed at which information is spread amongst crypto-community members in 2020 as compared to 2015, as well as the improved ability to instantly tag addresses as high-risk, now forces crypto-criminals to withdraw stolen assets in a much shorter period than they ever had to before.
Post-2022 update: bridge hopping compresses timelines further
The trend toward faster withdrawals has intensified since 2022. The rise of cross-chain bridges has further compressed withdrawal timelines. Where criminals once relied on mixers and peer-to-peer transactions that could take days to process, bridge-based transfers execute in minutes. A stolen asset on Ethereum can move to Tron, then to Solana, and onward to an exchange in a single session.
This speed places greater pressure on compliance teams and investigators to detect and flag suspicious activity quickly. The window for freezing stolen funds before they reach an exit point is now measured in hours rather than days.
Share of stolen fund withdrawal transfers to known entities (by hops)
The graph below shows the share of withdrawal transfers to known entities and the minimum number of hops made with untagged addresses.
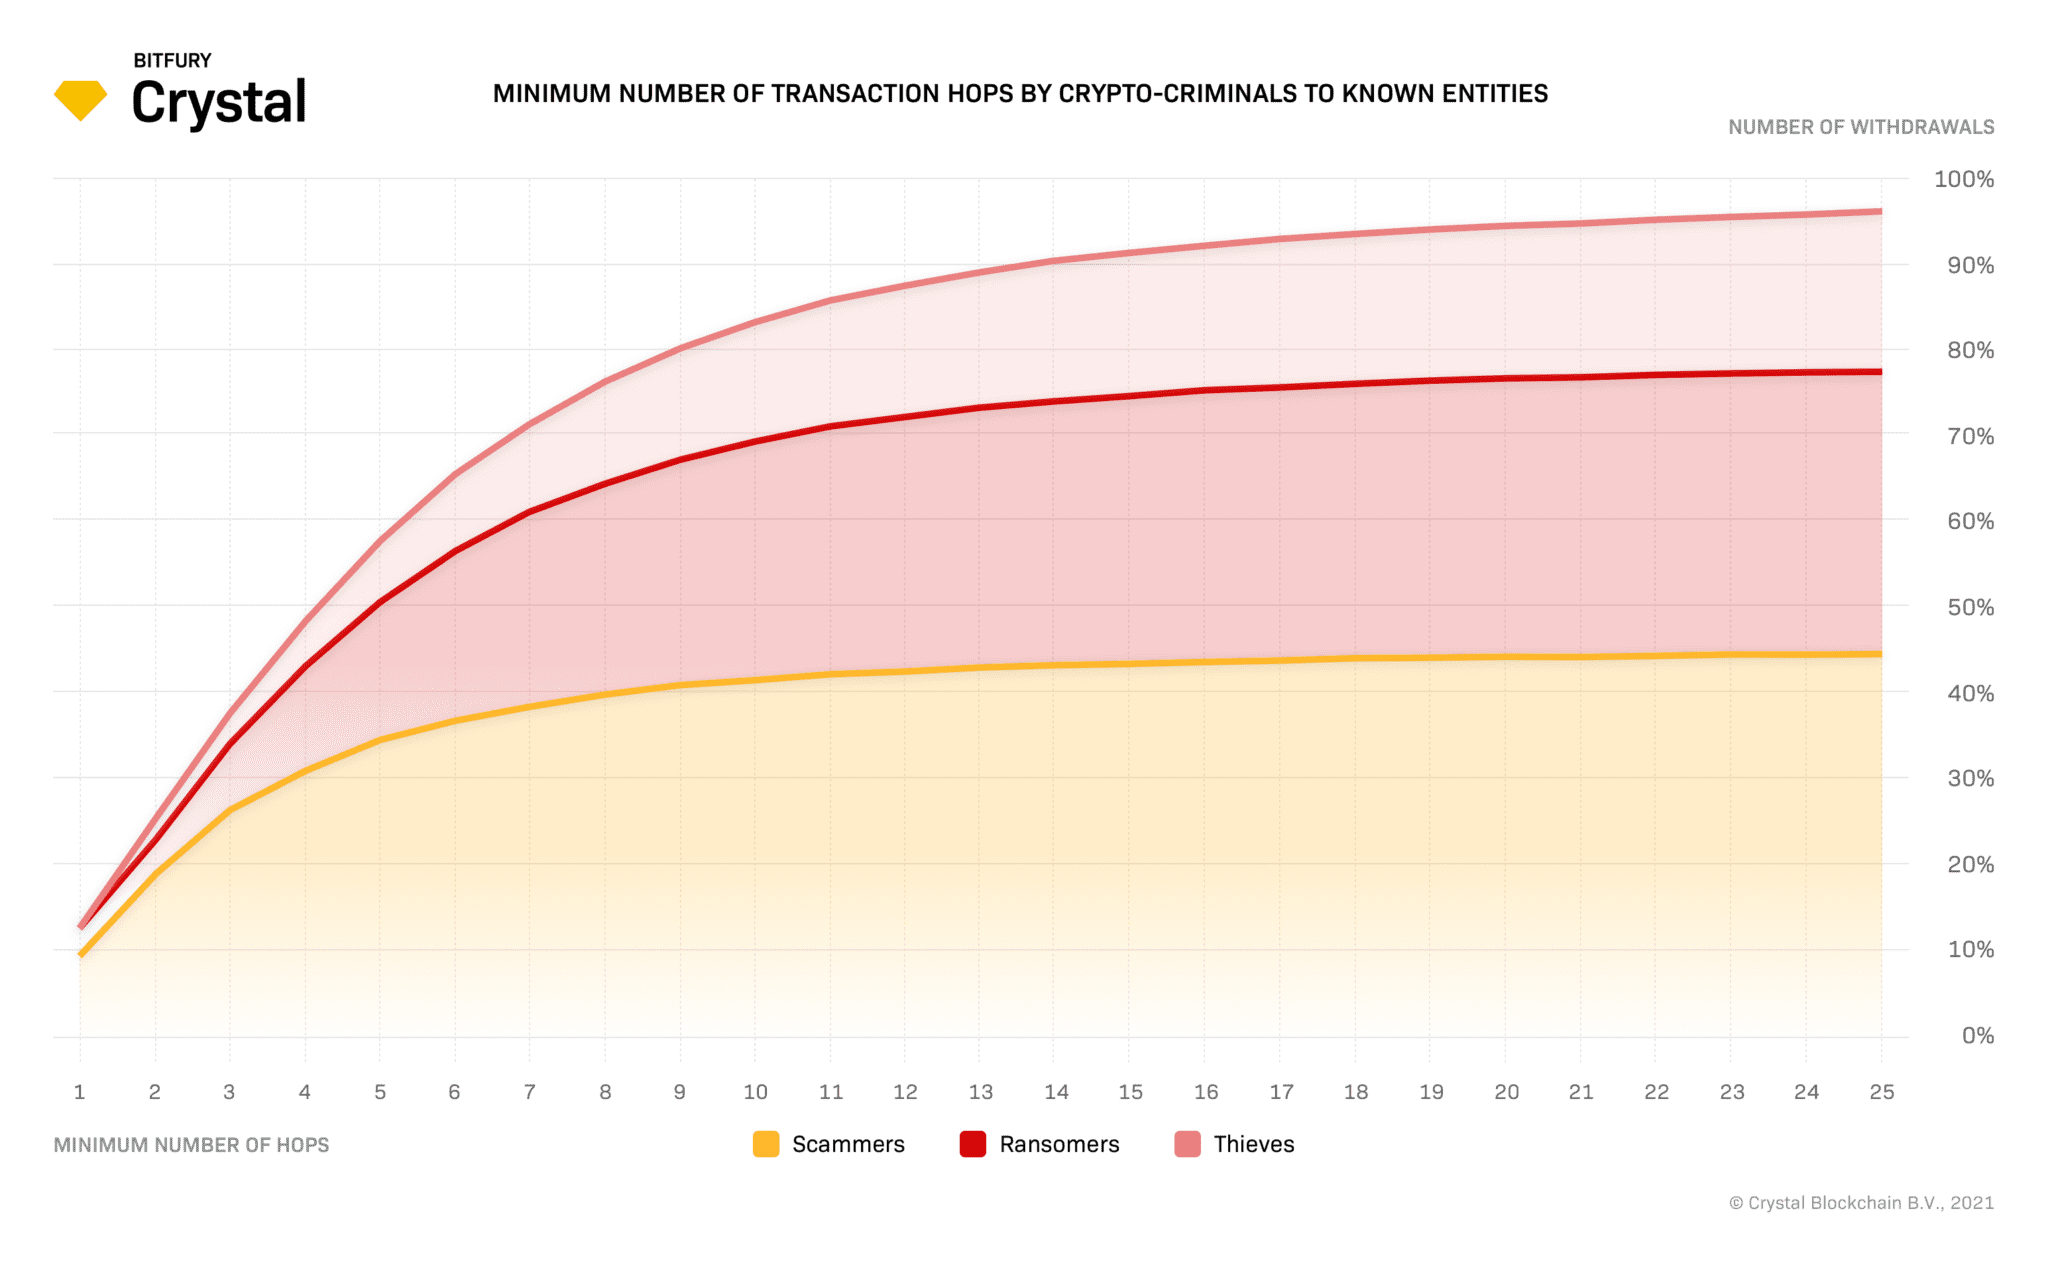
During the period 2015-2020, 81% of all crypto-criminal stolen fund transfers to known entities involved 9 hops between the breach and the entity, and 91% involved 14 hops.
The reason for this behavior (including several hops between an illegal withdrawal and a transfer to a known entity) is that a crypto criminal’s main intention is to obscure the trail of funds from the withdrawal and to mask signals indicating a tagged risky address. This then allows them to withdraw assets on exchanges that use low-quality tools or don’t use anti-money laundering tools.
Post-2022 update: hops now span multiple blockchains
The hop patterns documented above remain consistent, but the nature of the hops has changed. Before 2022, most hops occurred within a single blockchain. An investigator could follow a chain of Bitcoin transactions from the theft address through intermediary wallets to an exchange deposit address. Today, many of those hops cross blockchain boundaries. A single withdrawal path might include hops on three or four different chains, with bridge transactions connecting them.
Automated cross-chain tracing has improved significantly since this article was first published in 2021. Investigators can now automatically track the majority of swap operations across major blockchains, rather than manually reconstructing each bridge transfer step by step. But the complexity of cross-chain hop patterns means that coverage gaps still exist, particularly on smaller or newer chains. The race between obfuscation techniques and tracing capability continues.
Share of stolen fund withdrawal transfers to known entities (by year)
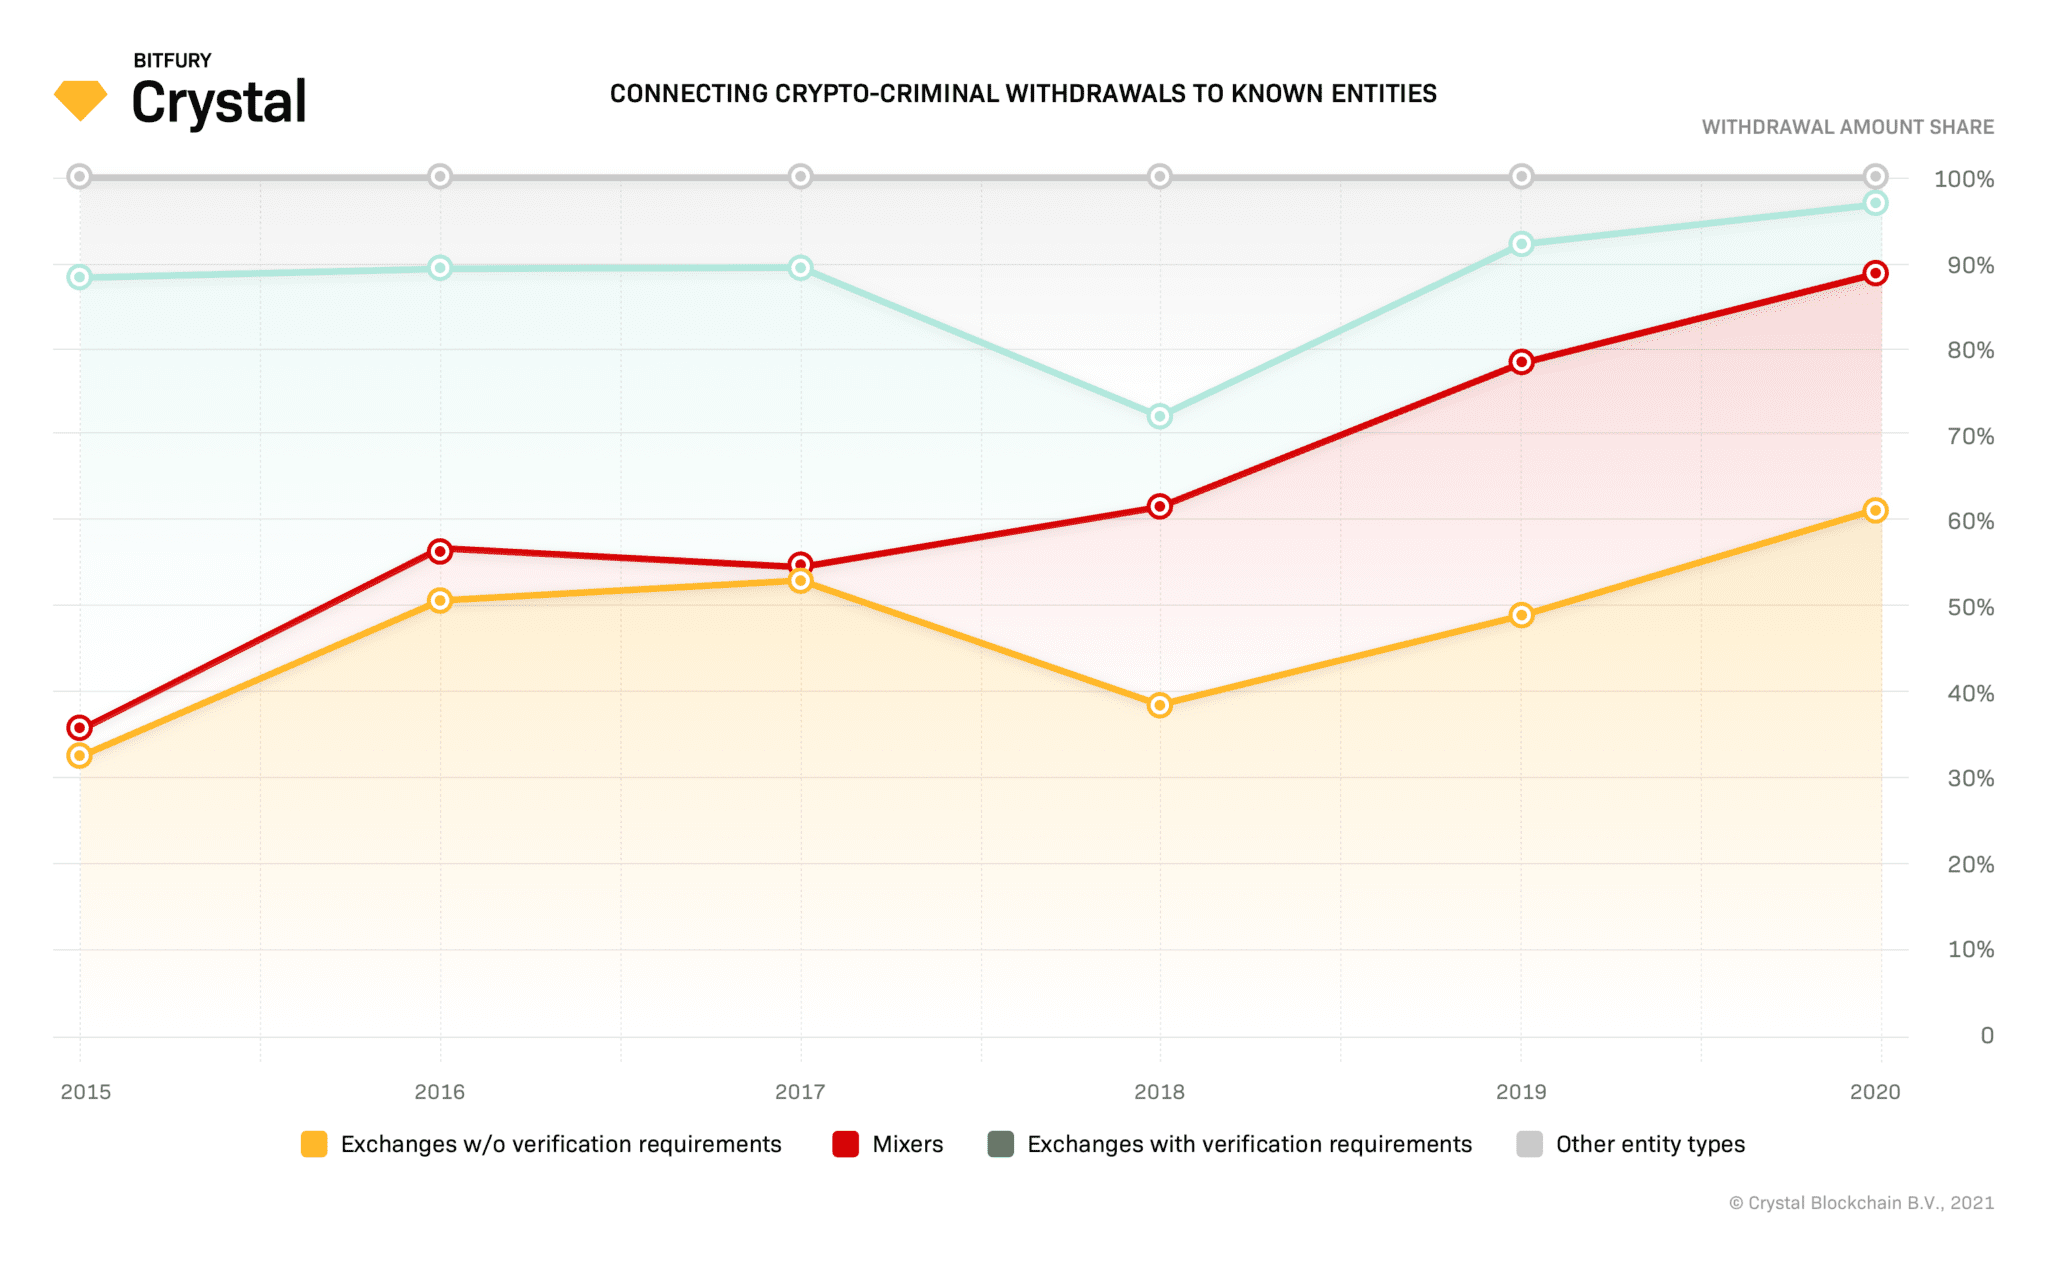
The most popular crypto-criminal fund destinations in 2015 were exchanges that required verification. 53% of the amounts received were sent through this type of entity. The second-largest share of stolen amounts was withdrawn through exchanges without verification requirements, accounting to 33% of the entities used. Other types of entities weren’t popular among crypto-criminals in 2015.
In 2020, however, these statistics changed noticeably: the share of stolen amounts withdrawn through exchanges with verification requirements dropped significantly to just 8%, while the share sent to exchanges without verification requirements grew to 61%. There is also a new destination for crypto-criminal withdrawals: mixers, which received 27% of stolen funds in 2020, compared to just 3% in 2015.
Exchanges with verification requirements are doing the best they can to comply with crypto-asset regulations. Verified exchanges were the first entity type to start using blockchain analysis and anti-money laundering tools, and they are the most active participants in the crypto-community fight against crypto-criminals. This is likely the main reason they’ve become such an unpopular stolen fund destination.
Exchanges without verification requirements haven’t been in as much of a rush to come in line with crypto-asset regulations, so they have no need to use analytics tools. Some exchanges that have little to no verification requirements don’t want to be regulated or to analyze their clients’ funds sources because they know they will lose a noticeable share of customers who use their services to stay anonymous.
The growing popularity of mixers among crypto-criminals is not that much of a surprise. These services were created primarily to entangle and obscure the flow of funds from stolen crypto assets, making them less traceable to compliance officers or investigators.
Mixer evolution since 2020
Mixer usage remains part of the criminal toolkit, but the landscape has evolved. The sanctioning of Tornado Cash in 2022 disrupted one of the most widely used mixing services, prompting criminals to seek alternatives. Newer mixing and tumbling services continue to operate, and some criminals now combine mixing with cross-chain movement for additional obfuscation.
Analytical techniques for demixing have also advanced. By analysing mixer inputs and outputs, it is now possible to surface candidate paths showing where funds likely moved after exiting a mixer. This does not guarantee full visibility, but it significantly reduces the time investigators spend on mixer-related cases compared to fully manual analysis.
Cross-chain movement: the dominant post-2022 withdrawal pattern
The most significant shift in stolen fund withdrawal patterns since 2022 is the widespread adoption of cross-chain bridges. Rather than keeping funds on a single blockchain and relying on mixers or layered transactions to obscure the trail, criminals now routinely move assets across multiple chains.
Bridge protocols allow users to transfer value between blockchains. Legitimate users rely on bridges for decentralised finance activity and portfolio management. Criminals exploit the same infrastructure to create complex, cross-chain withdrawal paths that are difficult to trace with single-chain tools.
A typical post-2022 withdrawal pattern might look like this: stolen ETH is swapped for a stablecoin on Ethereum, bridged to Tron via a decentralized bridge, converted to another token, moved to Solana via another bridge, and finally deposited at an exchange with weaker compliance controls. Each bridge hop adds a layer of complexity for investigators.
Over 75 bridge protocols are now in common use across Ethereum, Bitcoin, Tron, Solana, Polygon, Arbitrum, Base, and Optimism. The ability to detect when a transaction is a bridge transfer and to automatically connect the source and destination addresses across chains is now the critical capability that separates effective stolen-fund tracing from dead-end investigations. When funds appear to stop on one chain, the question is whether the analyst’s tools can identify that the funds continued on a different chain via a bridge, or whether that connection is invisible.
Case example: the Bybit hack, February 2025
The Bybit exchange hack in February 2025 illustrates how modern withdrawal patterns combine speed, scale, and cross-chain complexity. Approximately $1.4 billion in crypto assets were stolen in what became one of the largest exchange hacks in history. The attack was attributed to a North Korean threat group.
Following the theft, funds moved rapidly through a series of cross-chain swaps. The attackers used bridge protocols to distribute stolen assets across multiple blockchains within hours, making it significantly harder for any single-chain monitoring tool to follow the full trail.
The Bybit case reinforced a pattern observed in other major thefts linked to state-sponsored groups: stolen funds are moved quickly, split across chains, and routed through a combination of bridges, decentralized exchanges, and peer-to-peer services before reaching final destinations. The speed and scale of the distribution meant that by the time most monitoring systems flagged the activity, the funds had already moved through several chains.
Read more here
The growing role of off-chain intelligence in stolen fund tracking
Blockchain data shows where funds moved. It does not tell you who the victim was, how the theft was executed, or what happened outside the blockchain. As stolen fund withdrawal patterns become more complex, the value of off-chain intelligence has grown.
Victim reports are an increasingly important source. When victims of theft or scams report the addresses involved, along with details about the scheme, that information can be cross-referenced against on-chain data. If the same address appears in multiple victim reports across different jurisdictions, that pattern can accelerate investigations and help identify laundering networks that serve multiple criminal operations.
This represents a shift from the 2015-2020 period, when stolen fund tracing was almost entirely an on-chain exercise. Today, the combination of on-chain analysis with off-chain victim intelligence, law enforcement data sharing, and darknet monitoring provides a more complete picture of how stolen funds move and who is behind the movement.
Conclusions
The fundamental dynamic identified in the original 2015–2020 research remains true: criminals need to withdraw stolen funds quickly, and the window for intervention is short. What has changed is the complexity of the withdrawal paths they use.
Cross-chain bridges have given criminals new tools to move funds faster and across more blockchains than ever before. But the investigative and analytical tools available have also advanced. Automated cross-chain tracing, demixing capability and off-chain victim intelligence collectively mean that today’s investigators can follow withdrawal paths that would have been untraceable five years ago.
The most recent characteristics of crypto-criminal withdrawal patterns:
- Compressed withdrawal timelines, now measured in hours rather than weeks, are driven by the availability of cross-chain bridges.
- cross-chain hop sequences that cross three or four blockchains via bridge protocols, replacing single-chain intermediary patterns.
- Continued preference for mixers and exchanges without verification requirements, now combined with cross-chain routing for additional obfuscation.
- Growing sophistication in state-sponsored theft operations, as demonstrated by the Bybit hack, is using rapid cross-chain distribution at scale.
The race between criminals and investigators continues to accelerate. The organizations best positioned to respond are those with cross-chain analytical capability, off-chain intelligence sources, and the speed to act before stolen funds reach their exit points.
How Crystal supports stolen fund investigations
Crystal’s research team produced this analysis using attribution data covering 100,000+ entities across 330+ blockchains and 10,000+ digital assets. The platform’s bridge detection tracks 75+ protocols automatically, and 92-95% of swap operations are traced automatically across supported blockchains. Automated demixing surfaces up to five candidate paths from mixer outputs. Scam Alert integration provides off-chain victim-reported intelligence, with 15,000+ scams reported and 138,000+ addresses flagged.
For investigators and compliance teams working on stolen fund cases, Crystal Expert provides the cross-chain tracing, visualization, and case management capabilities described in this research.
Frequently asked questions
How do criminals use cross-chain bridges to move stolen crypto?
Criminals use bridge protocols to transfer stolen assets from one blockchain to another. For example, stolen Ethereum can be bridged to Tron or Solana, making it harder for single-chain tools to follow. Each bridge hop creates a break in the on-chain trail. The ability to detect bridge transactions and connect source and destination addresses across chains is now essential for effective stolen fund tracing.
How quickly do criminals move stolen crypto after a hack?
Research shows that most stolen funds begin moving within hours of a theft. The rise of cross-chain bridges has compressed this timeline further, allowing criminals to distribute funds across multiple blockchains within a single session. The faster stolen funds are flagged, the better the chance of intervention before they reach an exit point.
Can investigators still trace funds through crypto mixers?
Yes. While mixers add complexity, analytical techniques can now examine mixer inputs and outputs to identify likely paths funds took after exiting a mixer. Demixing can surface multiple candidate paths, significantly reducing investigation time compared to fully manual analysis. However, mixers remain one of the more challenging obfuscation techniques to trace completely.
What was the Bybit hack, and why does it matter for withdrawal pattern analysis?
In February 2025, approximately $1.4 billion was stolen from the Bybit exchange in an attack attributed to a North Korean threat group. The attackers used cross-chain bridges to distribute stolen funds across multiple blockchains within hours, demonstrating how modern withdrawal patterns combine speed, scale, and cross-chain complexity at the highest level.