
Key takeaways
- Market leaders USDT, USDC, and USDS show synchronized transfer cooling, down week-over-week from -19.89% to -33.14%. This indicates broad deceleration in demand rather than competitive displacement between major assets.
- FDUSD’s 388% transfer growth, from $2.1 million to $10.2 million daily, represents the strongest momentum amid widespread market cooling. This growth occurred while 16 of 20 analyzed assets recorded negative changes.
- DEX trading volumes remain stable compared to transfer activity. USDC maintains $2 billion in daily DEX volume despite a 22% transfer decline. This stability suggests underlying liquidity infrastructure remains robust.
- Supply dynamics show net weekly market expansion of $887 million, led by USDC at $1.32 billion. This suggests that institutional accumulation persists despite a cooling in retail transactions. Large holders continue building positions even as daily activity slows.
- Velocity patterns reveal intense utilization in specialized DeFi and regional assets. CRVUSD at 49.89% and CNGN at 47.45% daily velocity demonstrate focused use cases driving high turnover despite broader market cooling.
At a glance
| Total market cap
$271.13B |
24h transfer volume
$8.99B |
Assets analyzed
20 |
Market dominance
The top three stablecoins by market cap control 80% of the $271 billion stablecoin market. USDT leads with $183.7 billion in market capitalization, followed by USDC at $73.6 billion and USDS at $9.7 billion. Together, these three assets account for $266.9 billion of the total market value.
All three market leaders recorded negative week-over-week transfer volume changes. USDT decreased 19.89%, USDC dropped 22.27%, and USDS fell 33.14%. This synchronized deceleration indicates reduced utility despite stable market capitalizations. The data suggests that while holders maintain their positions, transaction activity has slowed significantly.
Total 24-hour transfer volume across the 20 analyzed assets reached $8.99 billion. DEX trading volumes remain more stable compared to transfer activity. USDC maintains $2 billion in daily DEX volume despite a 22% transfer decline. USDT follows with $1.2 billion daily, while USDS contributes $174 million as a third-tier liquidity provider.
Market leaders performance
| Asset | Market cap | WoW change | DEX volume | Market share |
| USDT | $183.7B | -19.89% | $1.2B | 67.8% |
| USDC | $73.6B | -22.27% | $2.0B | 27.1% |
| USDS | $9.7B | -33.14% | $174M | 3.6% |
Momentum plays
While major assets cool, smaller stablecoins demonstrate strong week-over-week growth. FDUSD leads with nearly 400% acceleration in transfer activity. Daily transfer averages rose from $2.1 million to $10.2 million over the week. This growth represents the strongest momentum play in the current market environment.
CNGN, a regional stablecoin focused on the Nigerian market, gained 54.97% week-over-week. Daily transfer averages increased from $117,700 to $182,400. This growth reflects expanding regional adoption and increased cross-border payment activity in West Africa.
The data reveals an inverse correlation between market cap and transfer momentum. The top three assets by market cap show transfer declines between -19.89% and -33.14% week-over-week. Meanwhile, smaller assets show gains of +55% to +388%. This pattern suggests potential market saturation among major assets and growing demand for specialized or regional alternatives.
Top momentum gainers
| Asset | WoW change | Daily avg (before) | Daily avg (after) |
| FDUSD | +387.65% | $2.1M | $10.2M |
| CNGN | +54.97% | $117.7K | $182.4K |
Market cap changes
The two-week market cap percentage change reveals a clear bifurcation in the stablecoin market. Regional and specialized assets show the strongest growth, while established players and yield-bearing assets face contraction pressures.
Market cap two-week percentage change by asset
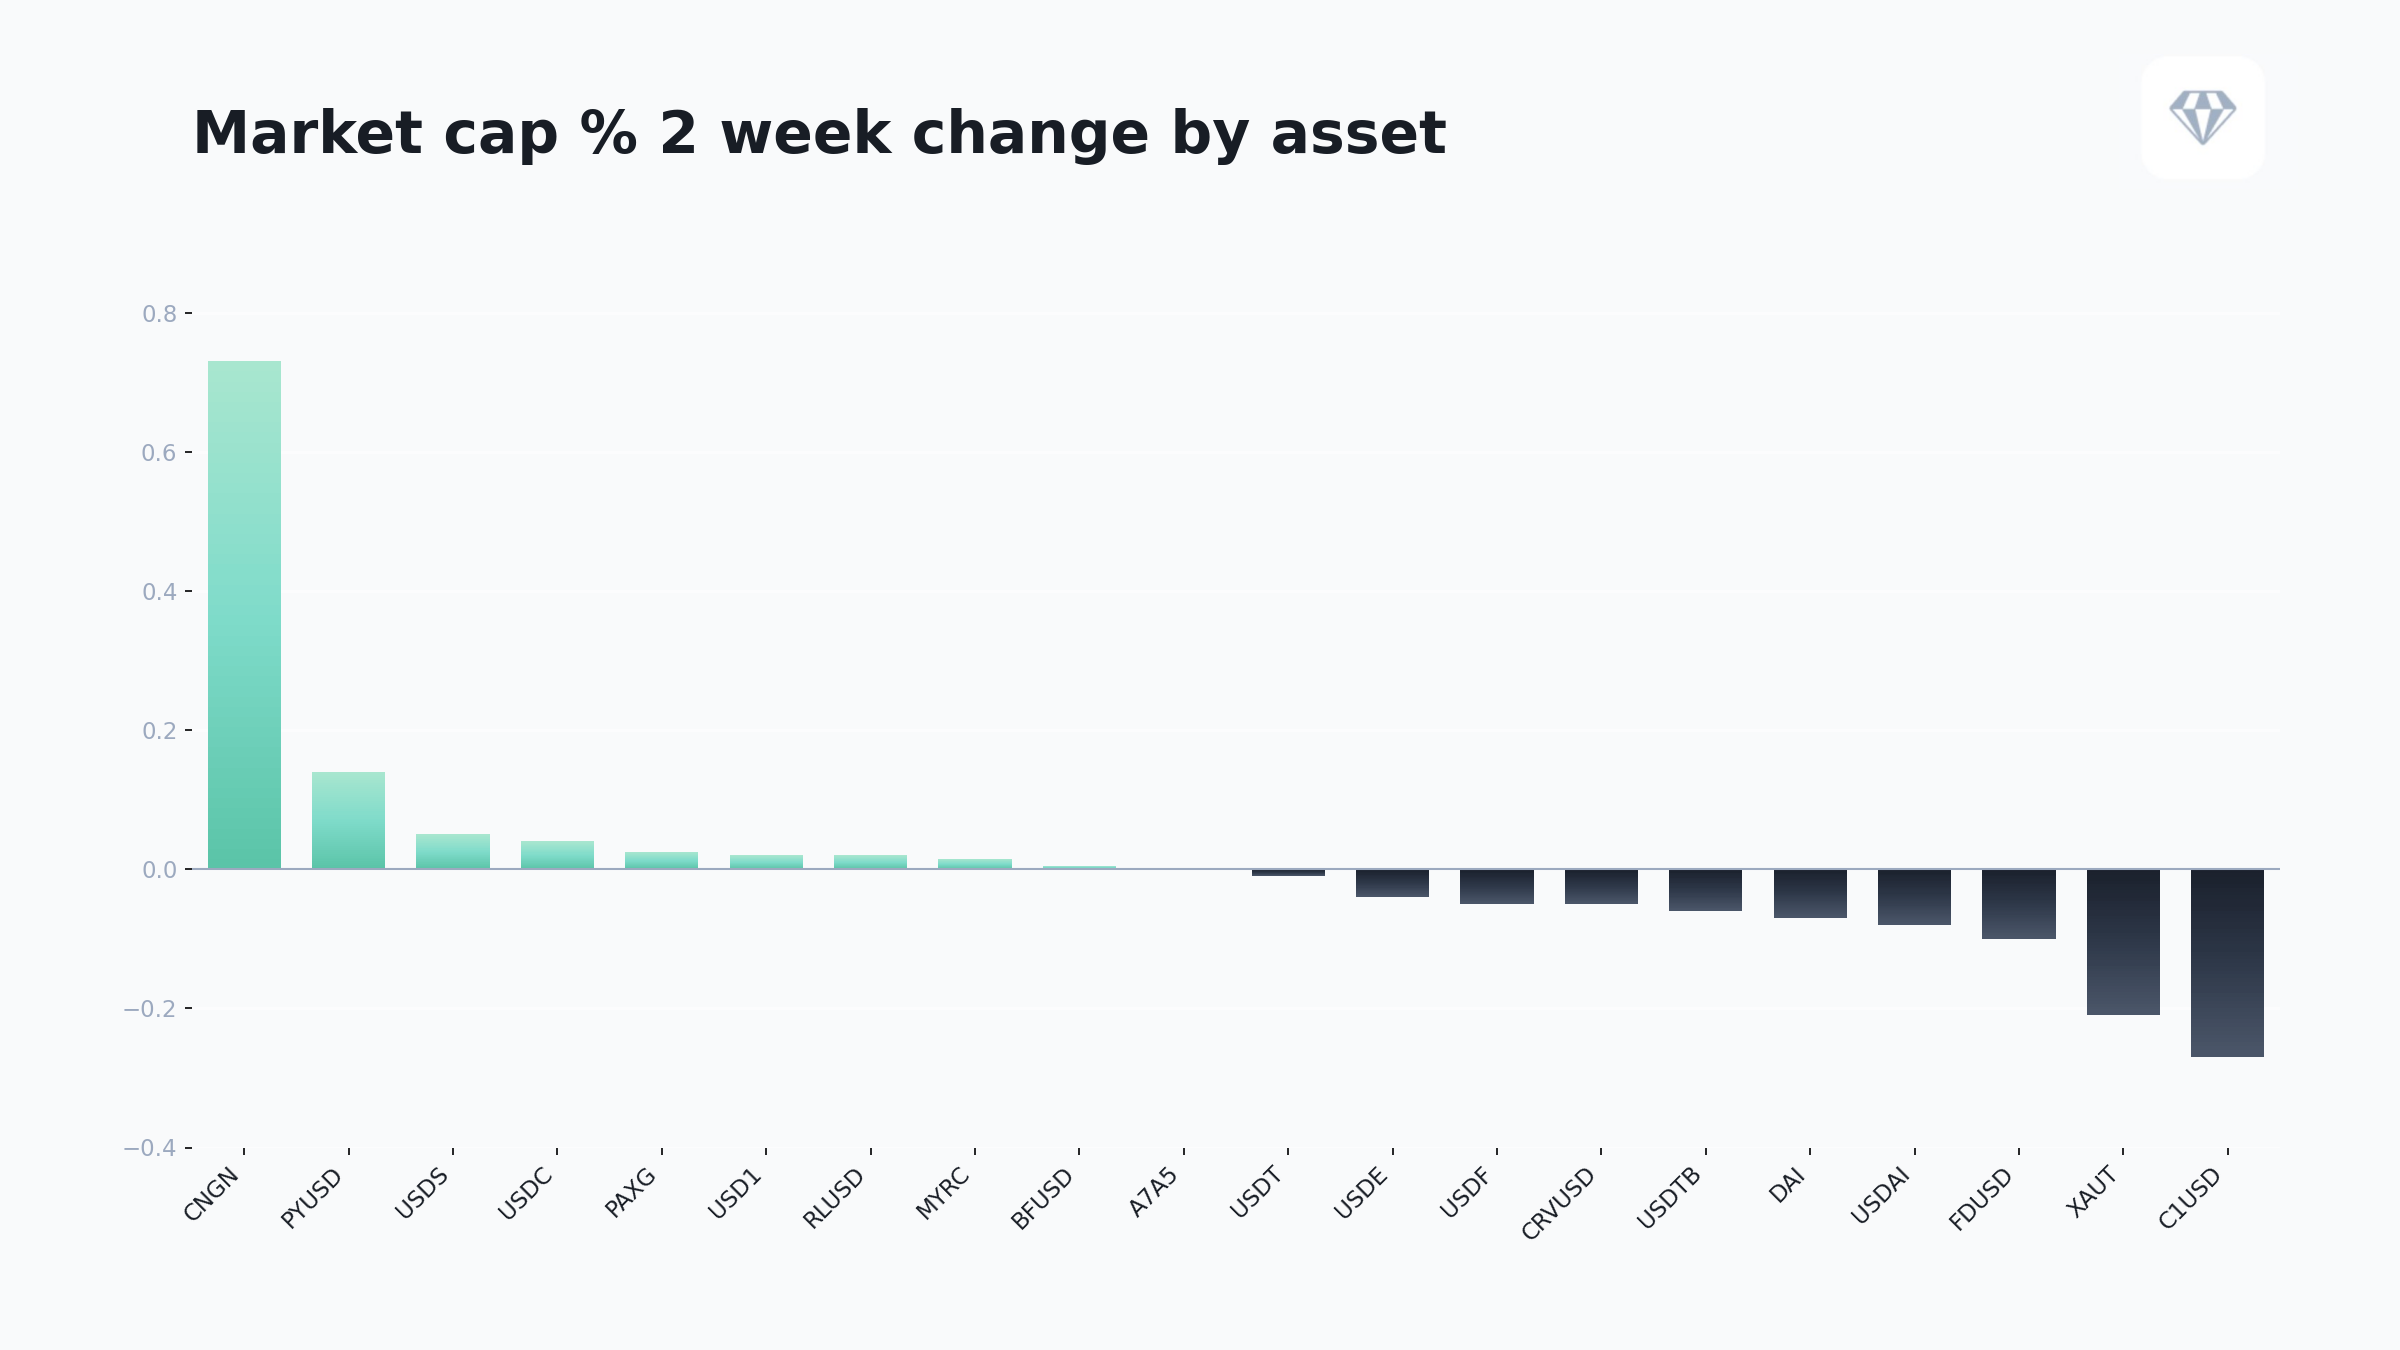
Figure 1: Market cap change over the last two weeks (Source: Crystal Foresight)
CNGN leads market cap growth at approximately +145% over two weeks, reflecting strong regional adoption in Nigeria. PYUSD and PAXG follow with modest positive changes around +14% and +9% respectively. USDS, USD1, RLUSD, USDC, and MYRC all recorded small positive changes between +2% and +6%.
USDT remained flat over the two-week period despite its dominant market position. Several assets recorded negative market cap changes. C1USD showed the largest decline at approximately -27%. XAUT, FDUSD, USDAI, USDTB, CRVUSD, USDF, USDE, and DAI all recorded negative changes ranging from -2% to -16%.
Velocity insights
Velocity measures how frequently a stablecoin changes hands relative to its supply. High velocity indicates intense utilization within specific use cases. Low velocity suggests holding behavior or reserve accumulation.
CRVUSD recorded the highest daily velocity at 49.89%. This indicates that nearly half of the total supply changes hands each day. Such high turnover reflects intensive use within Curve Finance DeFi protocols. CNGN follows with 47.45% daily velocity, demonstrating strong transaction activity relative to its smaller supply base.
Major assets show lower but more stable velocity patterns. USDAI recorded moderate velocity at 4.94%, though with a declining trend. The velocity concentration in specialized DeFi and regional assets indicates focused use cases driving intensive turnover rates. Meanwhile, major stablecoins serve more as stores of value and settlement rails than high-frequency trading instruments.
Velocity comparison
| Asset | Daily velocity | Category |
| CRVUSD | 49.89% | Ultra-high turnover |
| CNGN | 47.45% | Regional adoption |
| USDAI | 4.94% | Moderate, declining |
Supply dynamics
Supply expansion and contraction patterns provide insight into institutional and retail demand. Net minting indicates new capital entering the stablecoin market. Net redemptions signal capital exiting or moving to other asset classes.
Net expansion
Net supply expansion reached $1.74 billion, led by USDC ($1.32 billion), USDS ($301 million), and FDUSD ($58 million). USDC’s large expansion despite transfer declines suggests accumulation by institutions or protocols. The continued expansion indicates underlying confidence in stablecoin utility despite reduced transfer activity.
The pattern indicates potential accumulation or reserve building rather than active trading. Large holders appear to be increasing their stablecoin positions despite reduced transaction activity. This could signal preparation for future market opportunities or strategic repositioning.
Net contraction
Supply contractions totaled $853 million across three assets. USDT led redemptions at $400 million, followed by USD1 at $141 million and USDE at $128 million. This redemption activity reflects profit-taking or strategic repositioning.
USDT’s large net burn alongside transfer decline suggests reduced institutional demand or migration to alternative assets. The contraction pattern varies across asset types and backing mechanisms. This divergence between USDT contraction and USDC expansion indicates shifting preferences among large holders.
The overall balance shows net market expansion of $887 million. This indicates overall growth despite selective redemptions. The stablecoin market continues to expand in absolute terms even as transaction patterns shift and capital rotates between assets.
Breaking patterns
Inverse correlation between market cap and transfer momentum
The stablecoin market exhibits clear momentum bifurcation. Established leaders lose transaction velocity while emerging alternatives accelerate. Top three assets by market cap show -19.89% to -33.14% week-over-week decline. Smaller assets gain +55% to +388% in the same period.
This inverse relationship between market dominance and growth momentum indicates possible rotation dynamics. Market saturation among major assets creates opportunities for specialized alternatives. Regional stablecoins and DeFi-focused assets capture transaction volume that previously flowed through market leaders.
Broad-based transfer volume deceleration
The widespread cooling in transfer activity spans USD stablecoins, algorithmic variants, and commodity-backed assets. Sixteen of 20 analyzed assets show negative week-over-week transfer growth. The average decline across major assets reached -35%.
This synchronized deceleration suggests macro factors rather than asset-specific issues. Possible causes include seasonal trading patterns, regulatory uncertainty, or broader crypto market cooling affecting transaction demand across all stablecoin categories. The widespread nature of the decline indicates systemic rather than idiosyncratic factors.
Market risks
Momentum reversal risk
Assets showing 30%+ transfer declines face adoption momentum reversal risk. USDS, PYUSD, and USDE fall into this category. These assets have not yet established strong network effects that could sustain adoption during periods of reduced activity.
Sharp deceleration could indicate early adoption phase completion without achieving sustainable transaction velocity. Newer entrants face particular vulnerability as they lack the established user bases and integrations that support major assets during downturns.
Liquidity fragmentation risk
Liquidity fragmentation risk remains low for now. However, smaller assets growing at 50%+ weekly rates may face sustainability challenges. FDUSD and CNGN show strong growth, but their continued success depends on maintaining sufficient DEX integration and market maker interest.
As volume disperses across more alternatives, individual assets may struggle to maintain sufficient liquidity depth. This fragmentation could increase slippage costs and reduce the attractiveness of smaller stablecoins for large transactions.
Market opportunities
Market share capture
Assets showing 50%+ week-over-week transfer growth amid broad market cooling demonstrate potential to capture market share from decelerating leaders. FDUSD and CNGN lead this category. The momentum divergence creates opportunities for emerging stablecoins to establish network effects while major competitors plateau.
Regional stablecoins serving underbanked markets present particular opportunities. CNGN’s growth reflects strong demand for stable digital currency in Nigeria, where traditional banking infrastructure remains limited. Similar opportunities may exist in other emerging markets with high remittance volumes and limited banking access.
Value in oversold leaders
Market leaders experiencing transfer cooling while maintaining strong DEX volumes and supply expansion may represent oversold conditions. USDT, USDC, and DAI fall into this category. Their fundamental infrastructure advantages could drive recovery once broader market sentiment improves.
These assets maintain deep liquidity, broad exchange integrations, and regulatory relationships that smaller competitors lack. When market activity rebounds, established stablecoins are positioned to capture renewed transaction volume. Current weakness may present accumulation opportunities for long-term holders.
Market outlook
Short-term outlook
Expect continued bifurcation between cooling major assets and accelerating alternatives over the coming weeks. The current momentum shifts may stabilize as transfer patterns find new equilibrium levels. Major assets are likely to maintain their market cap dominance despite reduced transaction activity.
Key metrics to monitor
Five metrics warrant close attention in the coming weeks.
- FDUSD transfer sustainability above $200 million weekly will indicate whether current growth represents lasting adoption or temporary speculation.
- USDT transfer stabilization around $5.5 billion daily would signal floor formation for the market leader.
- CNGN velocity maintenance above 40% will demonstrate continued regional demand strength.
- Major asset DEX volume resilience above current levels would support the thesis that underlying utility remains intact despite transfer cooling.
- Supply expansion continuation despite transfer cooling would confirm institutional accumulation.
Potential catalysts
Several factors could shift current market dynamics. Regulatory clarity in major jurisdictions would boost confidence in established stablecoins. New DeFi yield opportunities could drive adoption of specialized assets. Increased cross-border payment demand would support regional alternatives like CNGN. Completion of current institutional accumulation cycles could release capital back into active trading.
Legal Disclaimer
The information provided in this content is for general informational purposes only and does not constitute legal, financial, compliance, or other professional advice. Readers should seek appropriate professional guidance before acting on any information contained herein.
While Crystal Intelligence endeavors to ensure that the content is accurate and up to date, no representations or warranties, express or implied, are made regarding its completeness, accuracy, or reliability. All content is provided on an “as is” basis, and Crystal Intelligence accepts no liability for any loss arising from reliance on this information.