
Key takeaways
- USDT crossed 50% organic share for the first time in this report’s tracking. Of $322.05B in gross transfer volume, $164.41B was genuine money movement, a 7.3 percentage point improvement in settlement quality, even as gross activity fell 22.5% week on week.
- USDC processed $982.02B in gross transfers but delivered only 7.1% as organic usage. The remaining $912B was DEX liquidity, lending collateral, and other DeFi mechanics. The asset behaves more like an infrastructure rail than a payment instrument.
- USDS expanded supply by $498.2M while processing $1.03B of organic usage from $21.14B gross volume. Sixty-seven percent of its volume is collateral posting. Supply growth is not being matched by genuine demand.
- USDE recorded the largest two-week market cap decline in the tracked universe at -35.4%, yet daily transfer activity rose 195%. Supply contracted by $1.45B in the week. The rising activity on a shrinking base points to redemption flows: holders are moving funds to burn, not to transact.
- PYUSD added 20 percentage points of organic share while growing gross volume 18.7%. Quality and quantity moved together. Market cap nonetheless fell 14.3% over two weeks, indicating consolidation around higher-quality flows.
- Net market supply contracted by $2.53B as $3.42B of contraction outweighed $892.7M of expansion. Most expansion came from infrastructure-focused assets; settlement-focused assets contracted.
The week in numbers
The 27-asset stablecoin universe ended the week to April 27 with a combined market cap of $306.60B. Across the seven days, gross transfer volume across the tracked assets exceeded $1.4 trillion, of which roughly 26 percent corresponded to genuine money movement. The remainder reflected exchange flow, DeFi mechanics, and supply operations.
What we call organic share is the percentage of an asset’s gross transfer volume that represents real-world settlement: peer-to-peer payments, merchant flow, and direct wallet-to-wallet movement. The complement is non-organic: exchange deposits and withdrawals, decentralized exchange liquidity, lending collateral, leverage cycling, issuance, and bridges. Two assets can post identical gross volumes and have entirely different economic meaning.
The headline development this week is USDT. Its gross volume fell 22.5 percent week on week to $322.05B, but its organic share rose 7.3 percentage points to 51.0%. The asset is processing less mechanical activity and a higher share of genuine settlement. USDC moved in the opposite direction in absolute terms: gross volume of $982.02B, organic share of 7.1%, with $912B of that volume produced by DeFi mechanics rather than payments.
Net supply across the tracked universe contracted by $2.53B. Contraction was concentrated in USDE, USDT, and PYUSD; expansion came from USDS, RLUSD, and USD1. The composition matters: assets growing supply this week are predominantly in infrastructure roles, while settlement-focused assets are consolidating.
Market overview
Of the 27 assets tracked, the 13 largest by market cap account for 99 percent of the total. The table below shows their net transfer volume, the week-on-week change in that volume, and the share of activity that represents genuine money movement. The “How active” column is an editorial judgment based on the relationship between gross volume, organic share, and supply behavior.
Asset | Market cap | 7d net (avg/day) | WoW Δ | Organic share | How active |
USDT | $189.77B | $6.02B | +2.7% | 51.0% (+7.3pp) | High – payments now dominate, gross volume falling, organic share rising |
USDC | $77.88B | $2.16B | +13.2% | 7.1% (+1.0pp) | Low – DEX liquidity drives 58% of volume; payment use marginal |
USDS | $11.02B | $246.22M | +52.1% | 4.9% (+3.3pp) | Mixed – supply expanded $498M, but 67% of volume is collateral |
DAI | $4.67B | $64.46M | +12.7% | 6.9% (+3.3pp) | Low – 60% collateral, 32% supply mechanics; little payment flow |
USD1 | $4.40B | $75.06M | +15.8% | 5.0% (-4.6pp) | Falling – gross volume down 44%, organic share down to 5% |
USDT and USDC together account for 87% of the tracked market cap. Their behavioral split, high-quality settlement in USDT, and infrastructure in USDC set the tone for the rest of the report.
The settlement-quality split: USDT and USDC diverge
USDT’s settlement profile is now the cleanest among large-cap assets. Of $322.05B in gross volume, peer-to-peer payments represented 42 percent. Exchange flow accounted for 27 percent. DeFi mechanics, including collateral, leverage, and decentralized exchange liquidity, represented just 18 percent. The asset is functioning as a payment instrument, and the share of that function in its overall activity is rising.
USDC’s profile is the inverse. Of $982.02B in gross volume, 86 percent was financialized: 58 percent from decentralized exchange liquidity alone, with collateral posting at 27 percent and leverage cycling at 1 percent. Direct peer-to-peer payments accounted for 7 percent. The asset’s gross volume is three times USDT’s, but its genuine money movement is less than half.
The accountability lens here is straightforward. USDC issuance corresponds primarily to demand from automated trading and lending protocols, not from end-user payments. That is not a defect, infrastructure roles are real and useful, but it is a different financial product from the one USDT is becoming. Treating the two as substitutable for compliance, balance-sheet, or settlement-risk purposes overlooks an architectural difference that the data now makes explicit.
USDS shows the same pattern in concentrated form. Sixty-seven percent of its $21.14B in gross volume was collateral posting. Organic share rose from 1.6 percent to 4.9 percent week on week, better, but still in the lowest tier, yet the issuer expanded supply by $498.2M. The standard accountability question applies: if circulation is growing while genuine usage is not, what is the additional supply for?
The USDE paradox: rising activity on a shrinking base
USDE recorded the largest two-week market cap decline in the tracked universe, falling 35.4 percent. Supply contracted by $1.45B over the seven days, the steepest single-week reduction across all assets. Yet daily net transfer volume rose 195 percent week on week to $443M, with organic share holding at 34.2 percent.
The combination tells a specific story. Total demand for the asset is declining, but the remaining holders are moving it more frequently. When activity rises while market cap is declining, the most likely explanation is redemption activity: holders are moving funds to burn them, not to settle payments. This is the paradox resolved. The 92 percent top-10 concentration figure supports that reading: a small number of large holders dictate flow, and when they move, the entire transfer profile changes.
USDTB shows a similar pattern on a smaller scale. Market cap declined 32.1 percent over two weeks. Supply contracted $285.1M in the week. Net transfer volume rose 40 percent. These are the two clearest stress signals in the tracked universe this week, and both warrant continued examination.
Two-week market cap movers
The chart below shows the two-week market cap change across the tracked assets. The scale of moves at both ends of the distribution is wider than in the prior reporting period.
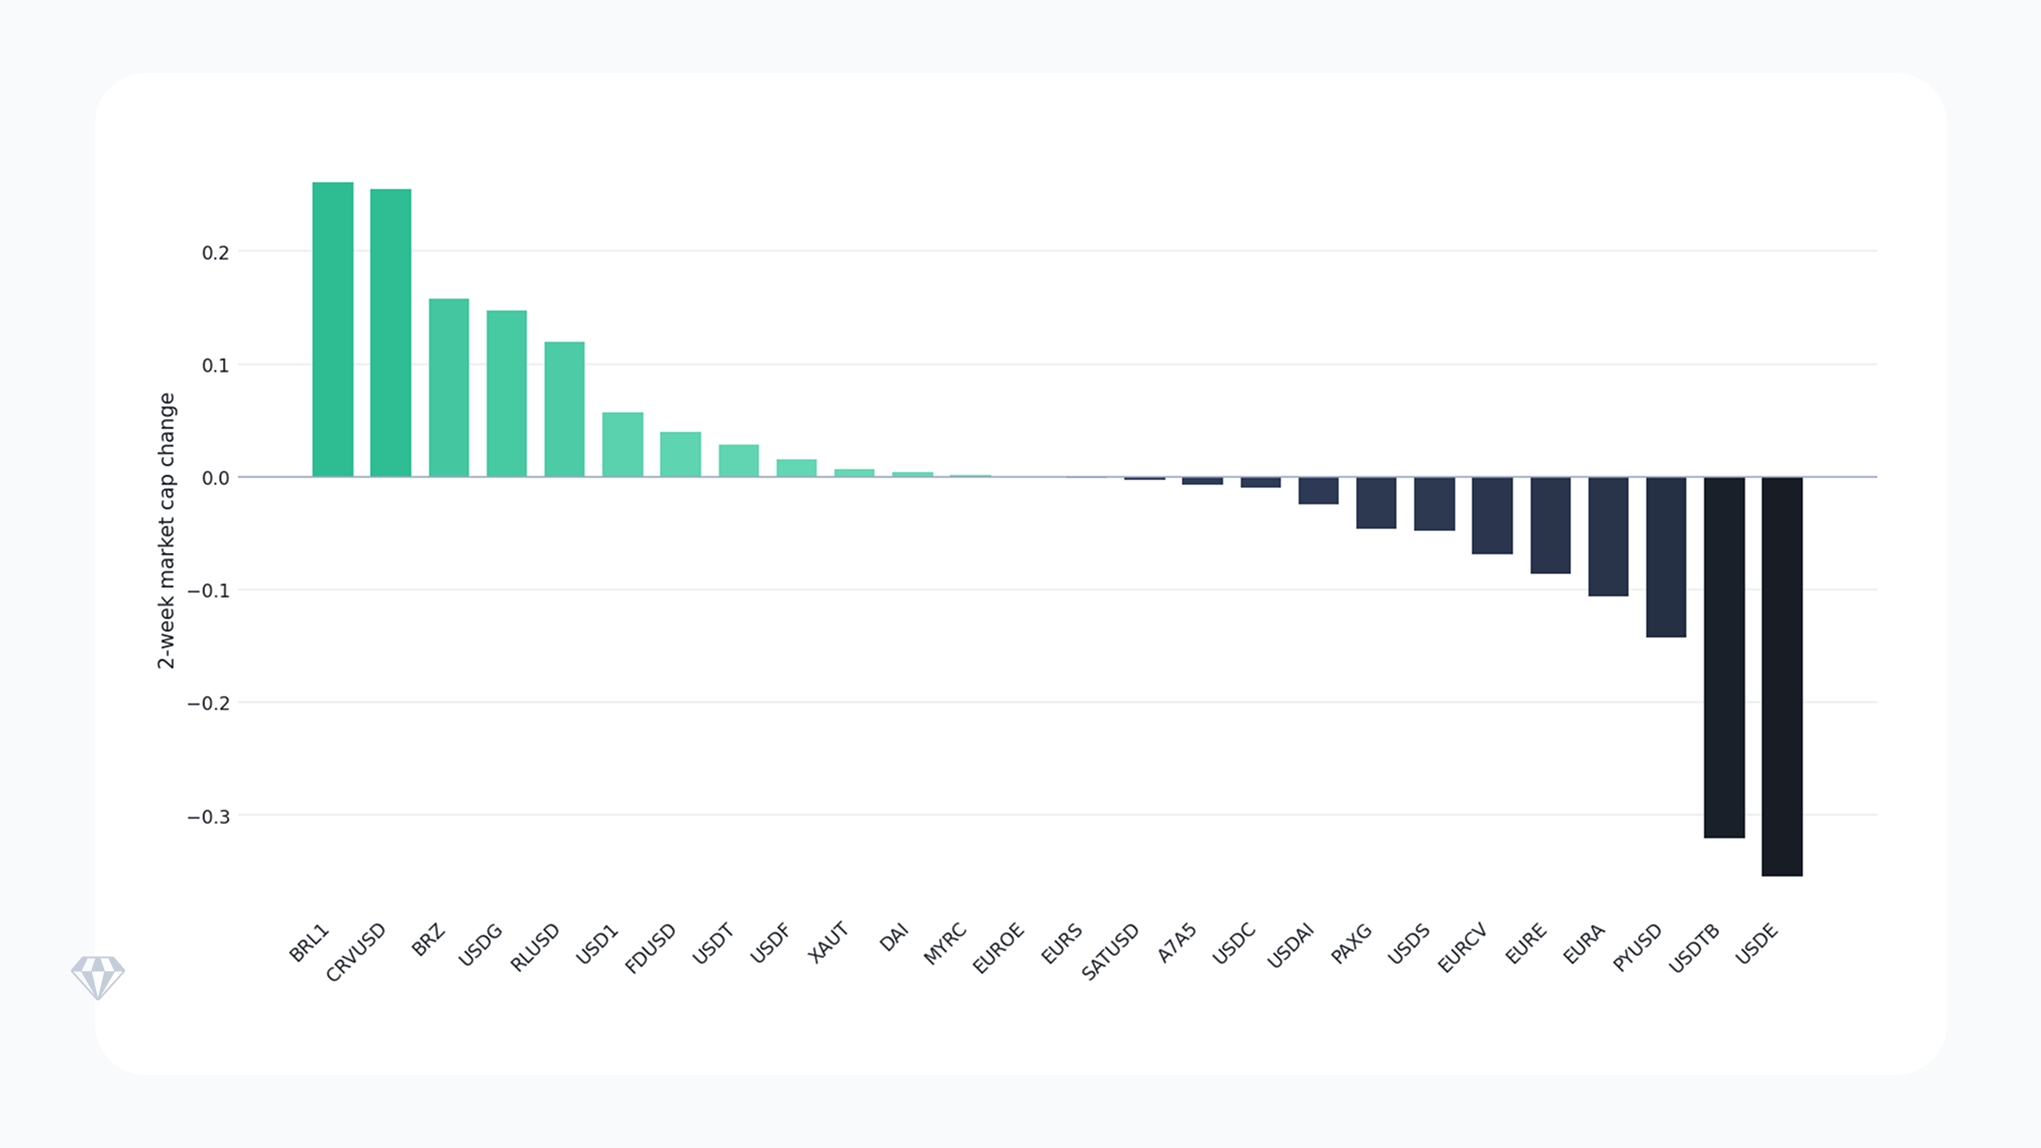
Source: Crystal Foresight, two-week market cap change by asset to 27 April 2026. Mint bars are gainers; navy bars are decliners.
BRL1 led gainers at +26.1 percent, followed by CRVUSD at +25.5 percent and BRZ at +15.8 percent. Two of these are small-cap assets where percentage moves on small absolute bases require care: BRL1’s market cap is $1.52M and BRZ’s is $333.66M. CRVUSD is the more substantive case at $291.47M, but its 22.2 percentage point organic share decline alongside the market cap rise indicates that the additional issuance is feeding DeFi infrastructure rather than payments.
USDG and RLUSD are the two most meaningful gainers over the past two weeks. RLUSD added 12.0 percent to its market cap while maintaining an organic share of 27.9 percent and processing $1.69B in genuine money movement at a 3.70 percent daily transfer velocity. That is the strongest combined signal of authentic adoption in the tracked universe.
At the other end, USDE at -35.4 percent and USDTB at -32.1 percent dominated declines. PYUSD’s -14.3 percent was substantial in absolute terms, although the simultaneous improvement in organic share suggests the consolidation is removing low-quality activity rather than displacing real users.
The composition of expansion and contraction is the more useful signal than the net figure. USDS expanded supply against an organic usage base of $1.03B, a circulation increase that is not visibly matched by settlement demand. RLUSD’s $141.4M supply increase is more defensible: it is paired with $1.69B in organic usage and rising velocity. USD1 expanded $141.0M, but its organic share fell from 9.6 percent to 5.0 percent, with gross volume contracting 44.4 percent. New supply on falling activity is a divergence worth tracking.
USDT’s contraction reads differently. Gross volume fell, supply fell, but organic share rose. That is orderly consolidation, not stress. Holders are not exiting; rather, the asset is processing less DeFi-mediated activity and a higher share of payments. Issuer supply management appears to be tracking that compositional shift.
Signals to watch
Velocity versus organic share
USDG posted the highest daily transfer velocity in the tracked universe at 6.41 percent, but its organic share fell 6.9 points to 17.0 percent, and gross volume fell 75.1 percent. The remaining velocity is exchange-mediated, with 68.7% of volume sourced from decentralized exchange liquidity. High velocity at low organic share is the volume fingerprint of a DeFi instrument under stress, not a payment asset under adoption.
RLUSD is the contrast. A velocity of 3.70 percent, paired with a 27.9 percent organic share and $1.69B in organic usage, indicates rising payment activity at a meaningful scale. BRLA at 3.51 percent velocity sits in a similar profile, although at a smaller absolute volume.
The PYUSD anomaly
PYUSD added 20 percentage points of organic share, from 13.7 percent to 33.7 percent, while gross volume rose 18.7 percent to $7.71B. Simultaneous improvement in quality and quantity is rare in this dataset. The 73.3 percent top-10 concentration figure means a relatively small number of holders are driving the change, but the direction is unambiguous and worth tracking into next week.
Concentration risk
USDS at 91.1 percent, USD1 at 91.3 percent, USDE at 92.0 percent, USDTB at 86.9 percent, A7A5 at 97.3 percent, USDAI at 98.8 percent, BRL1 at 98.7 percent, EURCV at 93.4 percent, EURS at 99.0 percent, and FDUSD at 92.7 percent all show top-10 concentration above 86 percent. In several cases, concentration sits alongside large supply moves and large velocity changes. Where a small group of addresses dominates flow, single-actor decisions translate directly into market-level signals.
Risks to monitor
Infrastructure-dependent supply growth
Where issuer supply expands but organic share remains in the low single digits, circulation is being absorbed by automated trading and lending protocols rather than payments. USDS this week is the clearest example. The risk is reflexive: if collateral demand softens, supply has to contract quickly, with knock-on effects on protocol liquidity.
Asymmetric settlement-quality moves
CRVUSD’s organic share dropped 22.2 percentage points in one week. MYRC’s rose 59.4 percentage points. Swings of that size at the small-cap end of the market reflect mechanical changes in single protocols rather than genuine demand shifts, but they affect any holder using these assets as collateral or settlement.
Stress in former growth assets
USDE and USDTB are the clearest stress cases this week, with two-week market-cap declines exceeding 30%. Whether these are isolated unwinds or the leading edge of broader yield-asset rotation depends on next week’s flows.
The questions to track into the following week are specific: does USDT hold above 50 percent organic share, or does it revert to infrastructure-pattern behavior; does PYUSD sustain simultaneous quality and quantity improvement, or does the higher organic share prove transient; and does USDS supply continue expanding without a corresponding rise in genuine usage?
Track stablecoin settlement quality with Crystal Foresight
Crystal Foresight provides cross-chain visibility into stablecoin transfer activity, organic share, and supply dynamics across the assets that issuers, compliance teams, and institutional participants depend on. Use it to separate genuine money movement from DeFi mechanics, and to act on signals before they become headlines.