Crystal Foresight tracks the $274.3 billion stablecoin market in real time, covering 99% of all stablecoin assets. Each week, this report highlights what the data shows about supply, transfer activity, and genuine use adoption, so that stablecoin issuers, financial institutions, and regulators can see beyond headline numbers to what is happening on-chain.
Key takeaways
- USDC added $1.55 billion in net supply and saw a 41.8% week-on-week transfer increase. However, 82% of its gross transfer volume reflects supply management operations, not genuine peer-to-peer activity.
- USDT maintained a 59.5% organic share on $4.95 billion daily net transfers, the strongest volume quality profile among large-cap stablecoins. It contracted supply by $492.5 million, consistent with demand-driven adjustment.
- Organic share divergence: XAUT leads at 76.8% organic activity. At the other end, DAI (1.6%), USDS (0.4%), and crvUSD (0.4%) show volumes dominated by protocol and issuer operations rather than user settlement.
- Supply expansion totaling $2.0 billion concentrated in assets with low organic shares – USDC and A7A5 accounted for the bulk. This raises the question of whether new supply is matching genuine user demand.
- USDAI lost 30.9% of its market cap over two weeks, the steepest decline in the tracked set. Transfer volume spiked 574.8% week-on-week, but from a very small base of $3.6 million to $24.2 million daily.
- Gold-backed tokens PAXG and XAUT posted 6.2% and 6.1% two-week market cap gains, respectively, reflecting broader precious metals strength rather than stablecoin-specific demand.
The $274.3 billion stablecoin market expanded supply by $2.0 billion this week. For the second consecutive week, that growth is concentrated in assets where most transfer volume comes from internal operations rather than users transacting. Last week’s question – whether USDC’s organic share would improve alongside supply expansion – now has a preliminary answer: it has not.
Crystal Foresight measures this through its volume fingerprint methodology, which separates gross transfer volume into supply management operations, protocol-driven activity, and genuine peer-to-peer transfers. The percentage of genuine transfers is the organic share. For a full explanation of how this works, see last week’s analysis. The sections below apply that lens to this week’s data.
Market overview
The table below covers the ten largest assets by market cap, with supply change, daily net transfers, week-on-week movement, and a volume quality descriptor.
Asset | Market cap | Supply change | Daily net transfers | WoW change | How active |
USDT | $183.8B | -$492.5M | $4.95B | +8.0% | High – genuine peer-to-peer activity |
USDC | $77.3B | +$1.55B | $1.73B | +41.8% | Low – 82% issuer operations |
USD1 | $4.6B | -$46.4M | $100.4M | -33.6% | Low – declining transfer momentum |
DAI | $4.5B | +$73.0M | $66.4M | +12.8% | Low-protocol recycling dominant |
PYUSD | $4.1B | -$82.0M | $63.1M | +89.2% | Moderate – mixed signals |
XAUT | $2.8B | $0 | $89.7M | -42.1% | High – genuine settlement activity |
PAXG | $2.5B | +$82.2M | $26.9M | -70.8% | Moderate – precious metals driven |
RLUSD | $1.6B | -$14.1M | $33.5M | +31.1% | Moderate – growing adoption signals |
A7A5 | $494.1M | +$264.0M | $109.8M | +32.1% | High – near-perfect organic share |
FDUSD | $373.0M | -$2.2M | $6.9M | +178.4% | Low – small base spike |
Three patterns stand out.
- First, USDC’s transfer growth of 41.8% far outpaces USDT’s +8.0%, but volume quality analysis below shows these gains are not comparable.
- Second, FDUSD posted a 178.4% week-on-week transfer increase, but from a small base of $2.5 million to $6.9 million daily – a footnote rather than a trend.
- Third, XAUT and PAXG saw sharp week-on-week transfer declines (-42.1% and -70.8%) after a period of elevated precious metals-driven activity.
How much activity is genuinely user-driven?
The organic share table below ranks assets by the percentage of their transfer volume that comes from genuine peer-to-peer activity
Asset | Daily transfer volume | Organic share | Key insight | Signal |
XAUT | $89.7M NET | 76.8% | Genuine settlement | Healthy usage |
USDT | $4.95B NET | 59.5% | Broad peer-to-peer | Healthy usage |
RLUSD | $33.5M NET | ~60% | Growing adoption | Positive signal |
USDC | $1.73B NET | 18.6% | Supply management | Not user-driven |
DAI | $66.4M NET | 1.6% | Protocol recycling | Structurally expected |
USDS | $246.3M NET | 0.4% | Supply management | Not user-driven |
crvUSD | $14.4M NET | 0.4% | Algorithmic operations | Not user-driven |
XAUT leads with a 76.8% organic share, meaning more than three-quarters of its transfer volume comes from genuine settlement activity. USDT follows at 59.5%, a strong result for an asset processing nearly $5 billion daily.
At the other end, USDC’s 18.6% organic share means that for every $1 of reported USDC transfer volume, less than $0.19 reflects genuine user activity. For the second consecutive week, supply expansion and organic share are moving in opposite directions.
DAI (1.6%) and crvUSD (0.4%) show even lower figures, though these are structurally expected for DeFi-native assets where protocol recycling is part of the design. The more concerning pattern is USDS at 0.4% organic share, combined with a 395.8% transfer spike – almost entirely driven by supply management operations rather than user demand.
Market cap – two-week percentage change
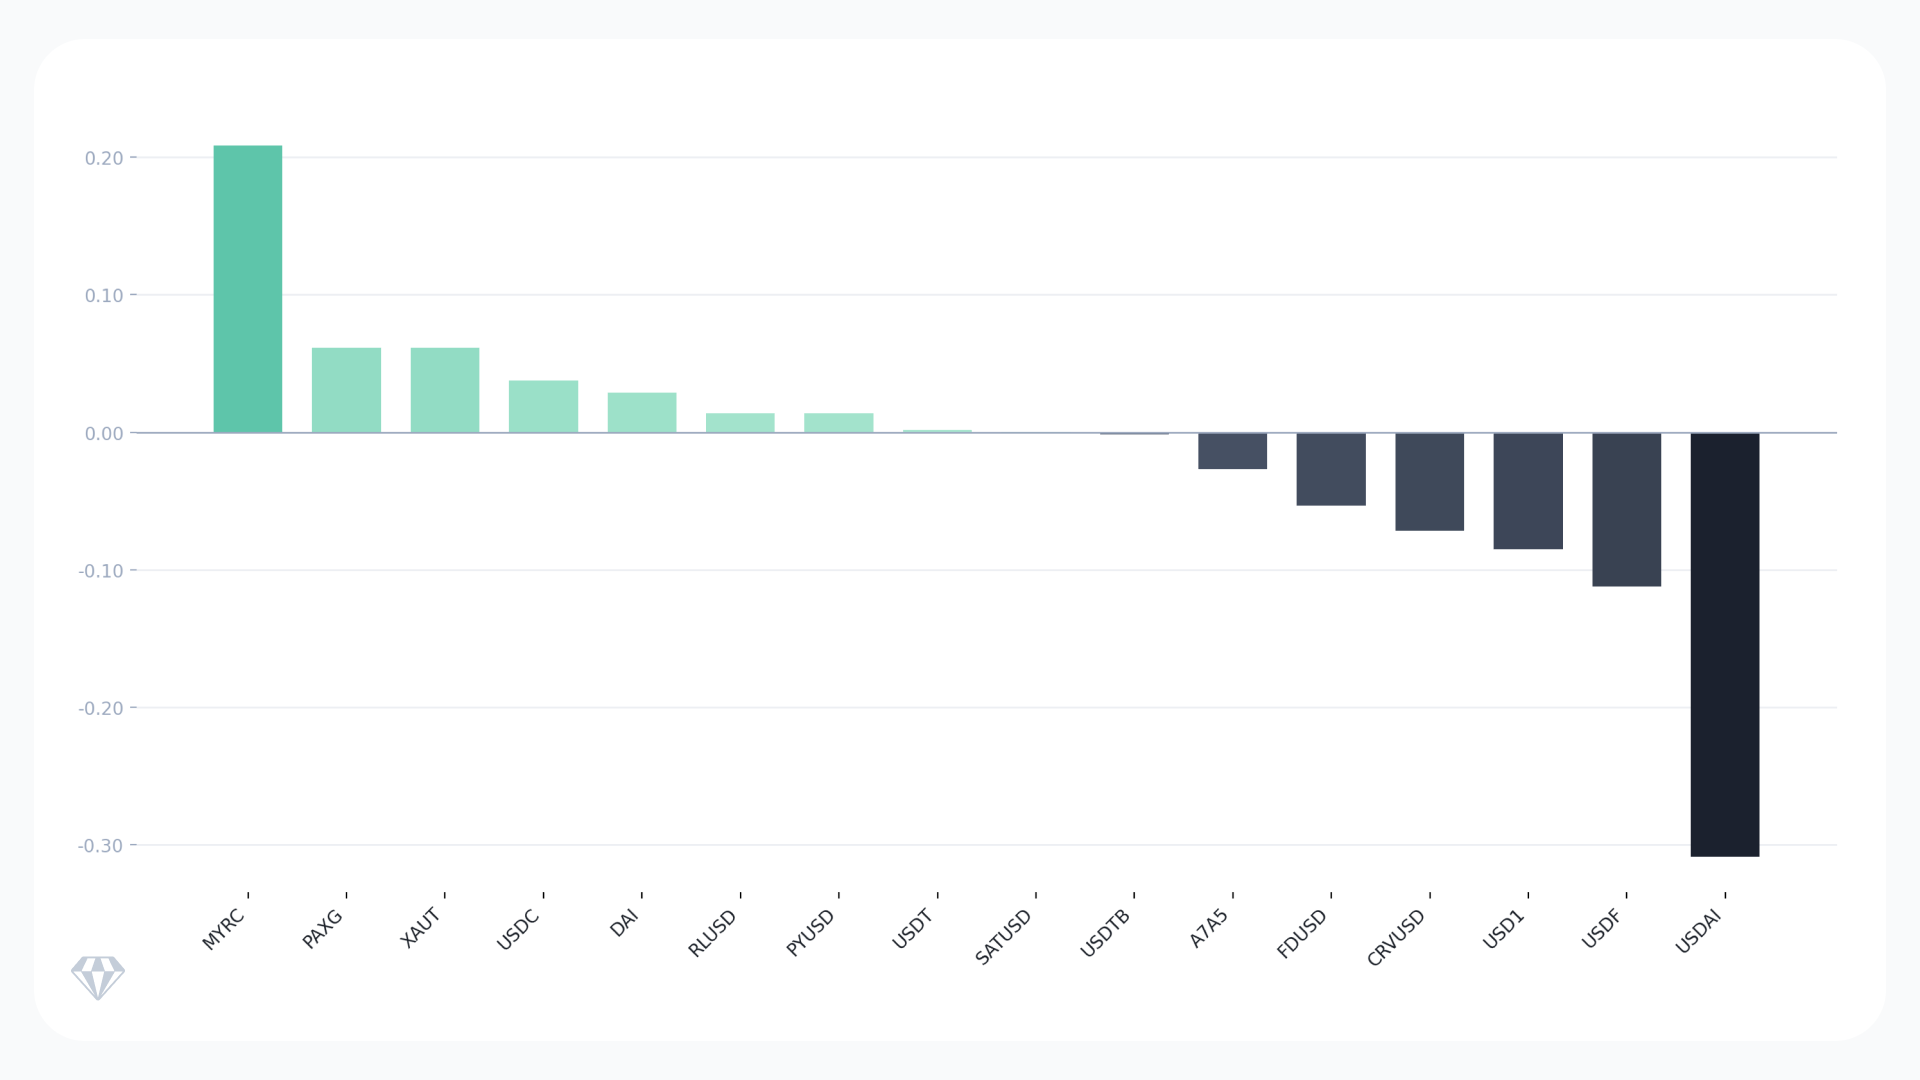
Source: Crystal Foresight
Among established assets, PAXG and XAUT each gained approximately 6.1-6.2%, driven by movements in precious metals prices rather than stablecoin-specific demand. USDC gained 3.8%, consistent with its aggressive supply expansion. MYRC posted the largest two-week gain at 20.9%, though on a micro market cap of $1.3 million.
On the downside, USDAI lost 30.9% of its market cap over two weeks. USDF declined 11.2%, and USD1 fell 8.5%. At the 90-day horizon, FDUSD has contracted 35.8% and USDAI 48.5%. These are not short-term moves – both assets are in sustained structural decline.
Supply dynamics
Where supply grew
Five assets expanded supply this week. USDC led with $1.55 billion in net minting, followed by A7A5 at $264.0 million, PAXG at $82.2 million, DAI at $73.0 million, crvUSD at $26.6 million, MYRC at $253,000, and SATUSD at $10,000. Total expansion reached approximately $2.0 billion.
Does this reflect genuine demand? For USDC, the organic share of 18.6% suggests it does not as supply is expanding faster than user-activity. A7A5 is the exception, despite its smaller scale, it achieves a high organic share, indicating its expansion may better reflect genuine demand. PAXG’s growth tracks precious metals prices rather than stablecoin adoption.
Where supply fell
USDT contracted by $492.5 million, the largest single-asset reduction. With a 59.5% organic share and stable transfer volumes, USDT’s contraction looks orderly. In other words, the issuer is reducing excess coins to match actual demand.
On the other hand, USDAI’s $145.0 million contraction, alongside its 30.9% two-week market-cap loss, points to an asset losing both supply and holder confidence simultaneously.
Other contracting assets include PYUSD (-$82.0 million), USD1 (-$46.4 million), RLUSD (-$14.1 million), FDUSD (-$2.2 million), and USDF (-$705,750). Total contraction reached approximately $782.8 million.
Signals to watch
Velocity and concentration
Velocity measures the percentage of an asset’s total supply that changes hands daily. crvUSD leads at 4.1%, followed by XAUT at 2.9% and PAXG at 2.7%. But velocity must be read alongside organic share. crvUSD’s high velocity with just 0.4% organic share means its activity is almost entirely automated or protocol-driven. XAUT’s 2.9% velocity paired with 76.8% organic share means its activity is user-driven, not automated.
Top-10 wallet concentration remains elevated across several assets. A7A5 (98.9%), SATUSD (98.8%), USDAI (94.3%), FDUSD (92.2%), USDTB (91.1%), and USD1 (88.3%) all show supply held overwhelmingly by a small number of wallets. USDT’s 27.5% top-10 concentration is the lowest in the tracked set, reflecting broad distribution.
Momentum
Week-on-week transfer leaders include USDAI (+574.8%), USDS (+395.8%), FDUSD (+178.4%), and PYUSD (+89.2%). In each case, context matters. USDAI and USDS have very low organic shares, so their spikes reflect operational activity. FDUSD’s increase came from a small base of $2.5 million. PYUSD’s 89.2% growth to $63.1 million daily is the most credible momentum signal among these, deserving closer examination of its organic share breakdown in the weeks ahead.
Risks
Volume quality: USDC, DAI, USDS, and crvUSD all show organic shares below 20%. For institutions using gross transfer volume to assess liquidity or market depth, these figures are not comparable to assets with a 60%+ organic share. The numbers are not wrong – they are measuring different things.
Concentration risk: Six assets carry top-10 wallet concentrations above 88%. A7A5 and SATUSD exceed 98%. At that level of concentration, a small number of large holders can move the markets significantly. (Note: USDS concentration partly reflects its official staking contract rather than pure holder concentration.)
USDAI: USDAI’s contraction pattern, flagged above, is the most concrete stress signal in this week’s data. Does it stabilize or accelerate next week?
Questions Crystal Foresight will track:
Will USDC’s organic share improve as its expanded supply enters circulation? Can PYUSD sustain its 89.2% transfer momentum, and what does its organic share look like? Will USDAI’s market cap contraction stabilize, or is this the beginning of a deeper decline?