



The stablecoin market set a record near $320B in May. By July 14 it had fallen to $306.5B, a decline of $11.5B, or 3.6%, over 90 days and the first quarterly contraction in almost three years. The drop was real, but narrow: a handful of coins did nearly all of the shrinking, each for its own reason. Here is what moved, and why.
Key takeaways
- A real, concentrated contraction. Net supply fell $11.5B. That is money redeemed, not merely moved, but a handful of coins did almost all of it.
- Each move has its own cause. USDe and USDS shrank because their yields were cut. USDC shrank because DeFi collateral demand cooled. USDT barely moved, and by strategy rather than yield.
- Coins are linked through their plumbing. USDe’s unwind alone pulled about $2B of USDC out of Ethena’s reserves.
- Gold-backed tokens fell for an unrelated reason. PAXG and XAUt lost a combined $0.9B as the spot gold price pulled back, not because of anything stablecoin-specific.
- The growth was bought, not organic. The fastest grower, USDG, expanded on yield-sharing rewards programmes: supply that leaves when the incentive does.
A record, then a real drop
For most of 2026 the stablecoin supply only rose. It reached an all-time high of $320.4B in mid-May. Over the 90 days to July 14 it fell from about $318B to $306.5B, a decline of $11.5B, or 3.6%, and close to $14B below the May peak. It was the first quarterly contraction since late 2023. June alone was the steepest monthly drop in dollars since the Terra collapse of 2022.
Stablecoins are burned when redeemed, so this was money leaving the chain for bank dollars: a genuine outflow, not a de-peg. What makes it worth unpacking is that the decline was lopsided. Strip the market down to the coins that moved, and the drop sits in a short list, each shrinking for its own reason.
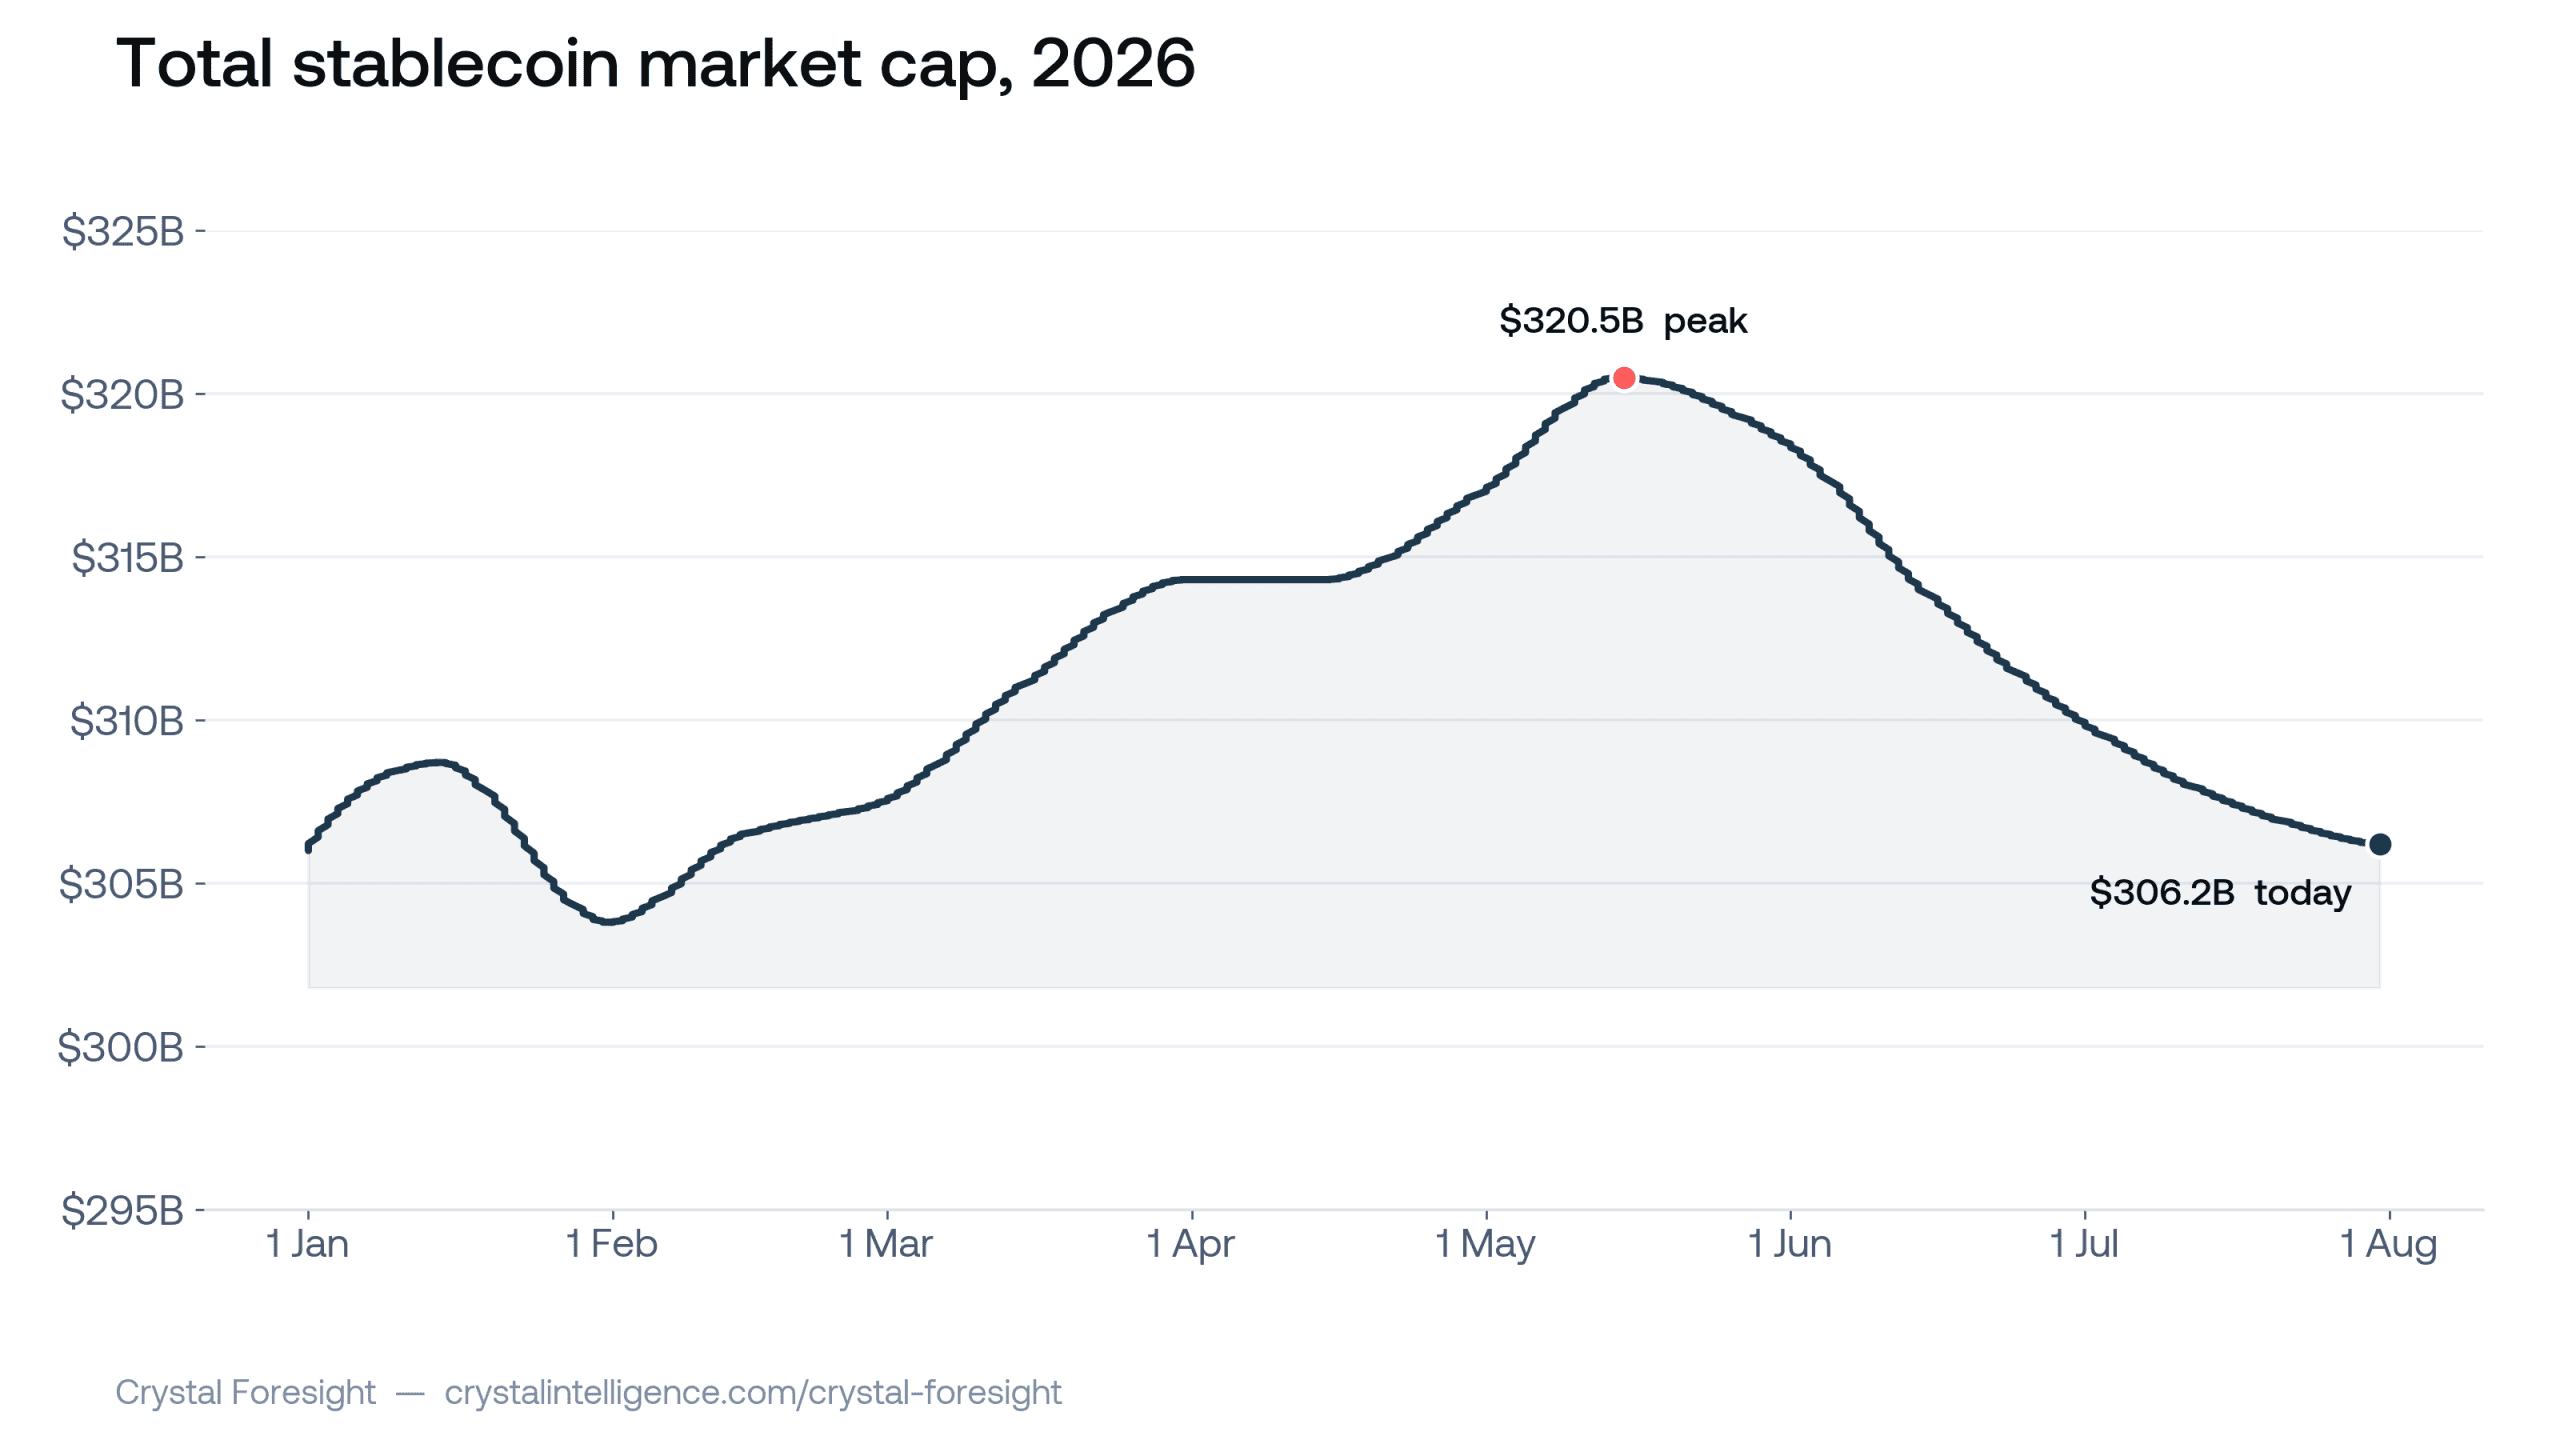 Above: Up to a May record, then down $11.5B over the 90-day window. Total stablecoin market capitalisation, all tracked assets, 2026. Source: DefiLlama.
Different coins, different jobs
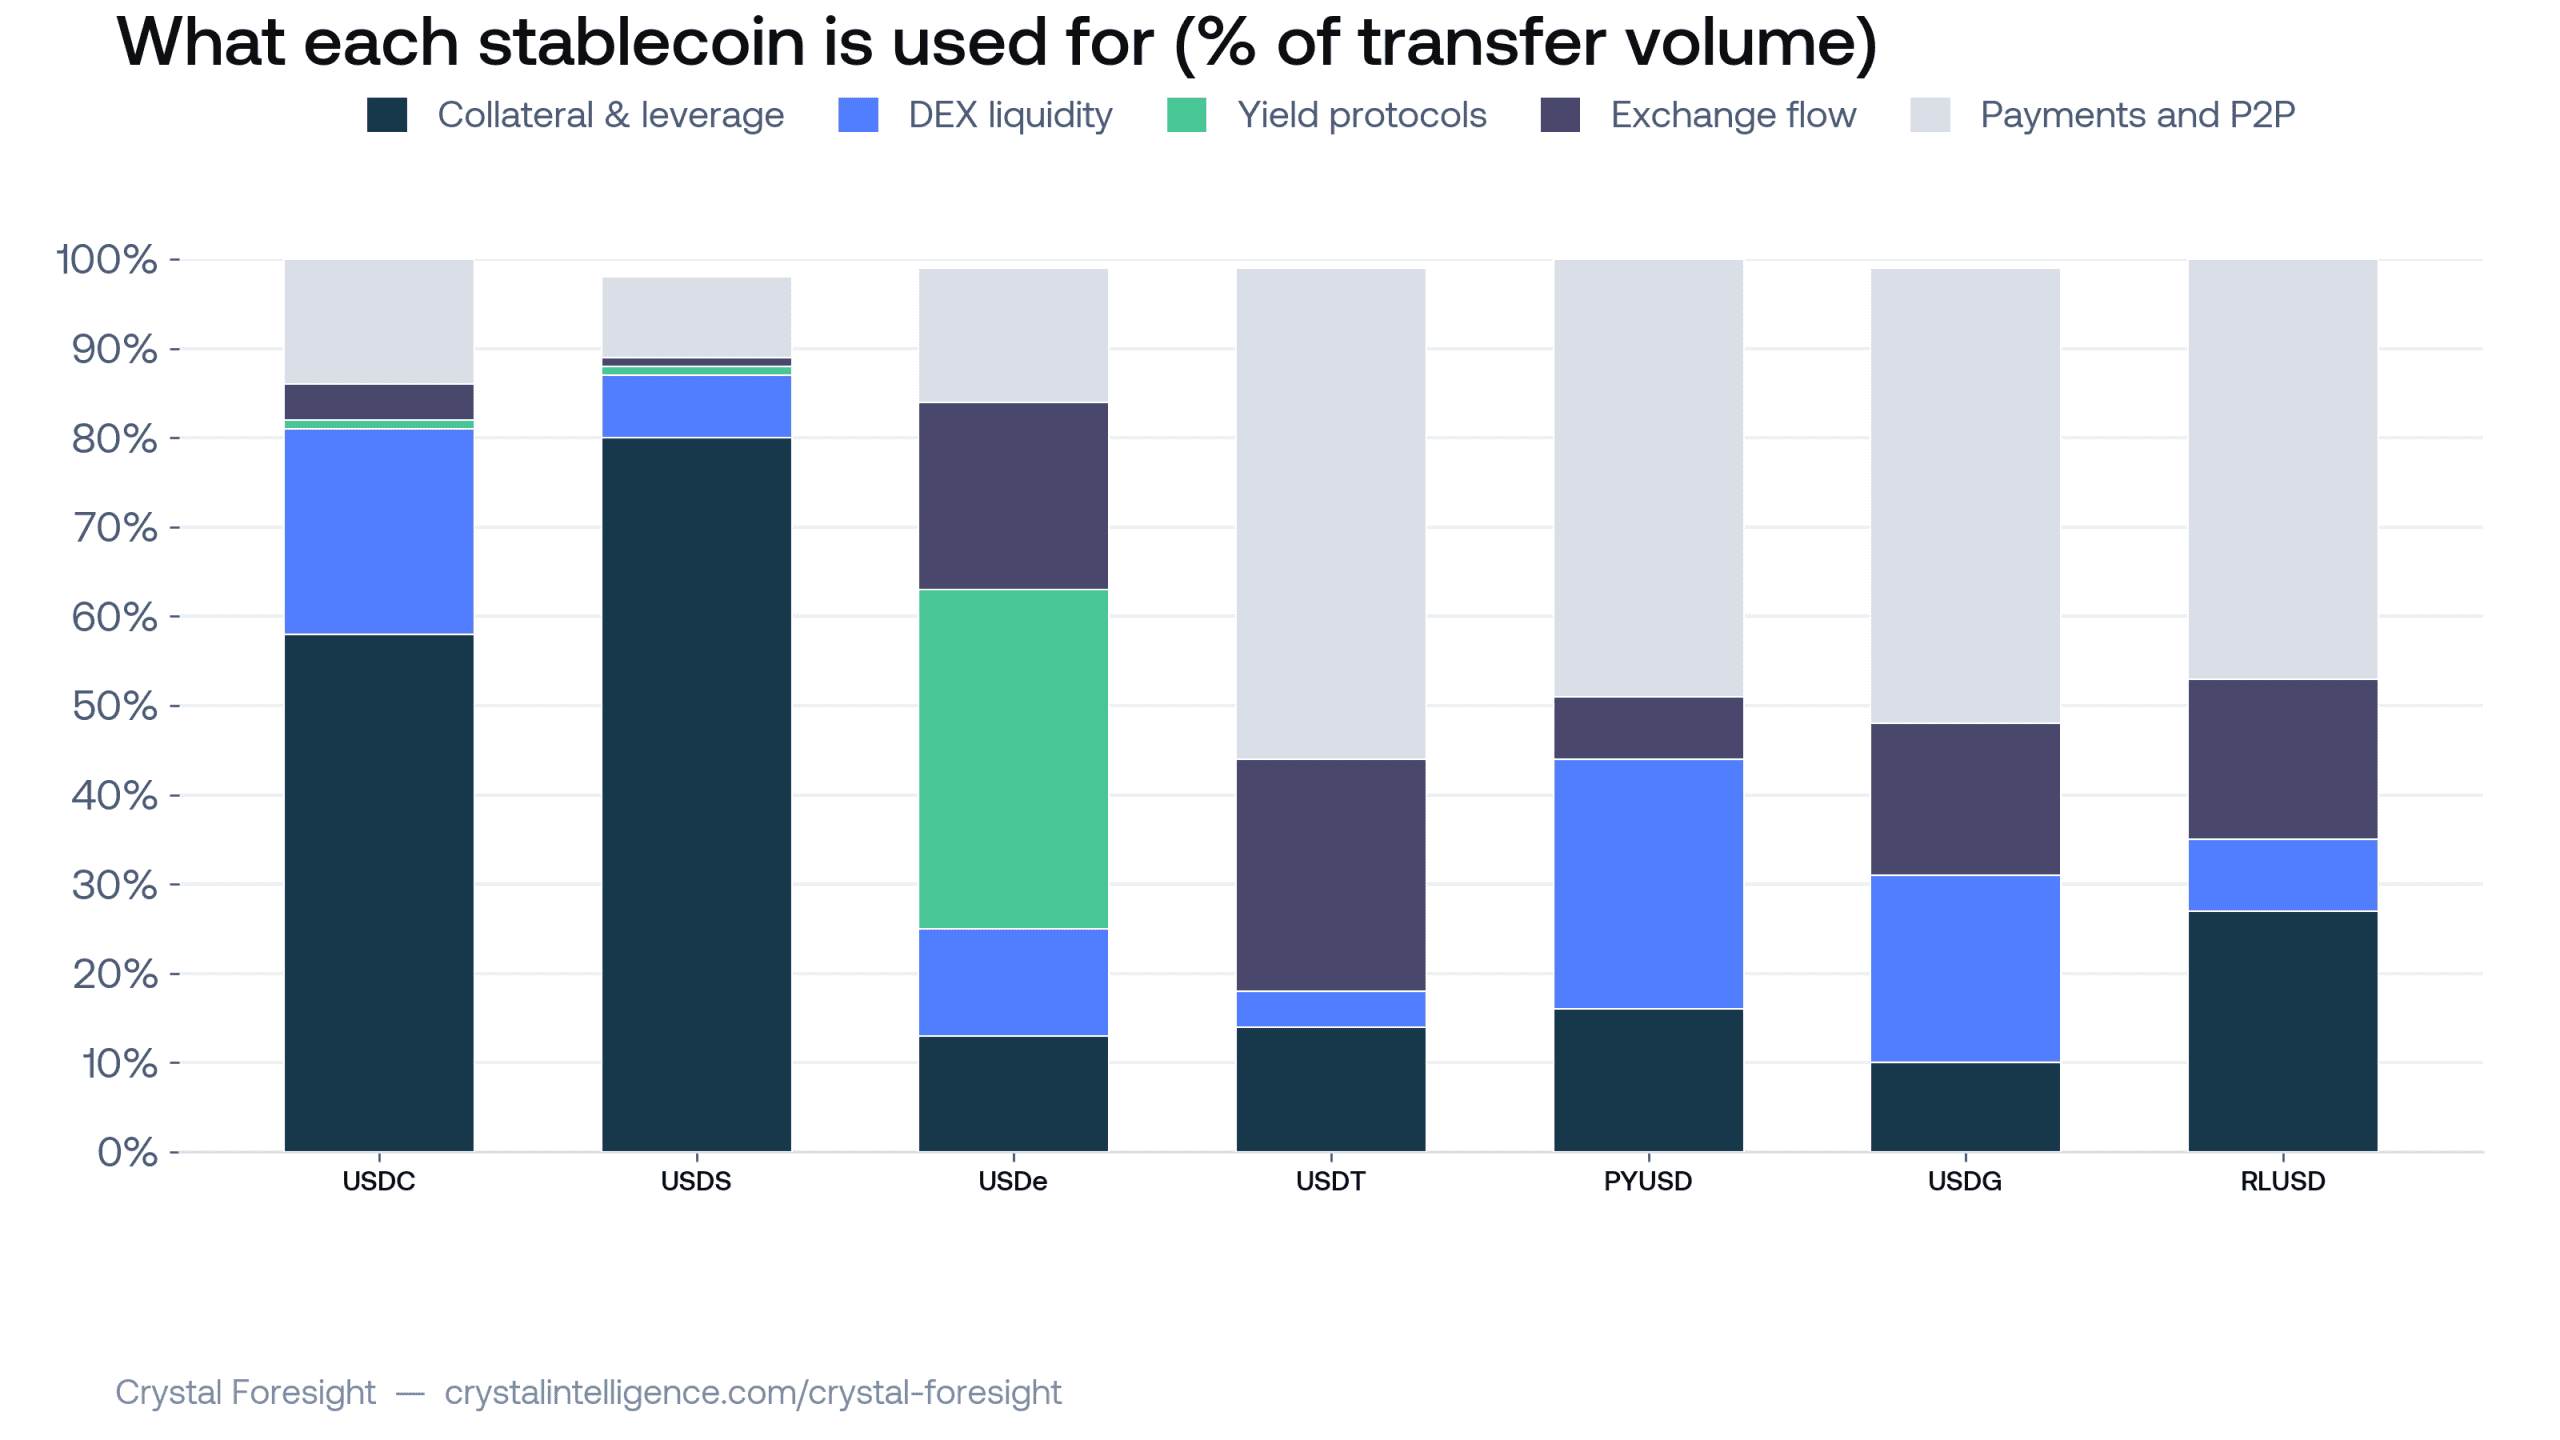
Stablecoins that all read as “a dollar on-chain” are used for very different things. Crystal’s transfer fingerprints make this visible. USDC and USDS are collateral coins: 58% and 80% of their volume is moving in and out of lending markets. USDe is a yield coin, with nearly 40% of its activity in yield-protocol flow. USDT is built for payments and trading: half is plain transfers, a quarter is exchange flow, and collateral is a minor use. Where a coin lives decides what can move it, which is why one quarter hit each so differently.
Who moved
Five coins did almost all the shrinking: USDC (−$5.8B), USDe and USDS (−$2.0B each), USDT (−$1.4B) and PYUSD (−$1.2B). Two gold-backed tokens also fell, for an external reason covered below. A smaller cohort grew: USDG (+$829M), USD1 (+$338M), DAI (+$251M) and RLUSD (+$67M). The growers together added barely a fifth of what the decliners shed.
The table below carries the full set, including the two gold-backed coins the chart shows but the narrative above does not name.
Coin | 90-day supply change | % change | Primary use | What moved it |
USDC | −$5.8B | −7.3% | Collateral (58%) | DeFi collateral demand cooling; one treasury relocation masked the depth of the drop |
USDe | −$2.0B | −34% | Yield (39%) | Funding-rate yield compressed; capital rotated to tokenised Treasuries |
USDS | −$2.0B | −23% | Collateral (80%) | Sky cut its Savings Rate from 6.5% to about 3.6% |
USDT | −$1.4B | −0.7% | Payments (55%) | Strategic positioning outside MiCA and the GENIUS Act, not yield |
PYUSD | −$1.2B | −31% | Payments / DEX liquidity | OCC proposal on issuer-linked yield; PayPal’s reorganisation |
PAXG | −$630M | n/a | Gold-backed | Spot gold price pullback |
XAUt | −$250M | n/a | Gold-backed | Spot gold price pullback |
RLUSD | +$67M | n/a | Payments | New institutional rails |
DAI | +$251M | n/a | Collateral | Mirror of USDS within Sky |
USD1 | +$338M | n/a | Payments | Native launch on the Tempo network |
USDG | +$829M | +40% | DEX liquidity / payments | Yield-sharing incentive programmes |
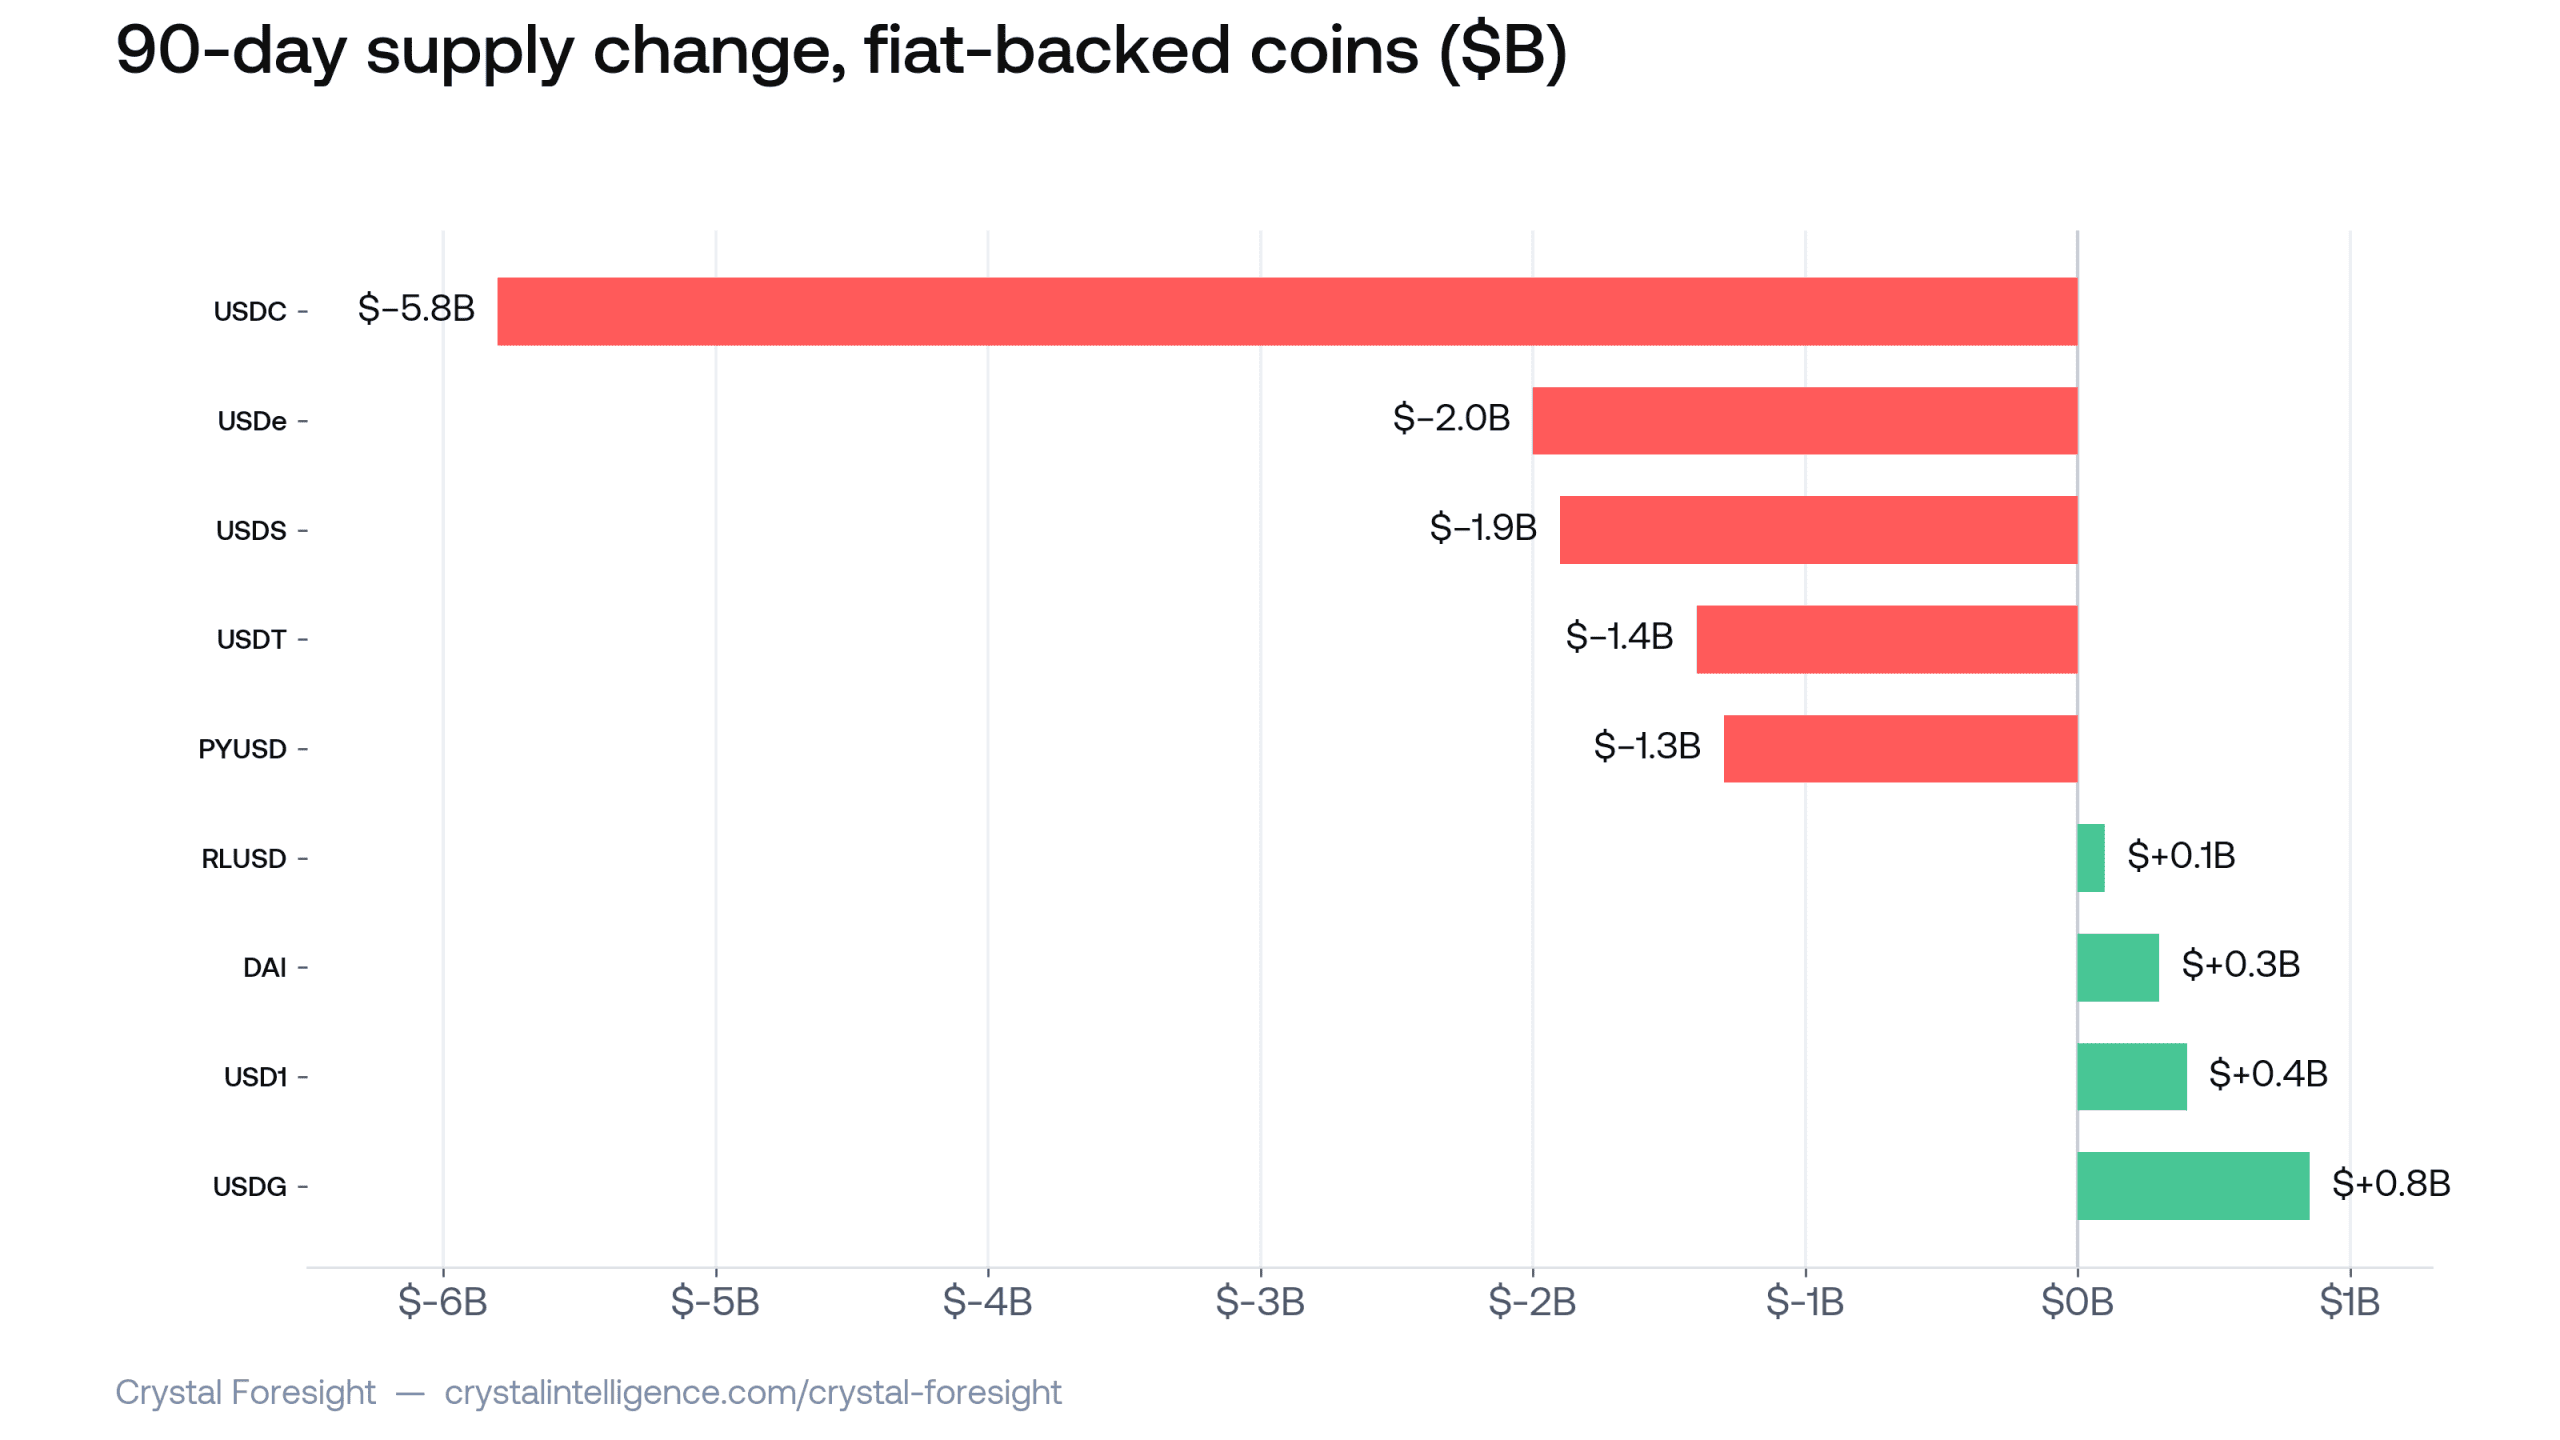 Above: The decline is concentrated. 90-day change in supply by coin, in billions. USDS shown from DefiLlama; other figures from Crystal’s on-chain data.
Gold-backed tokens: a different market entirely
PAXG and XAUt track the spot price of gold, not dollar demand. Spot gold fell by roughly a quarter from its January 2026 record above $5,590 an ounce, pressured by a stronger US dollar and fading expectations of Federal Reserve rate cuts. Their declines say more about the gold market than about stablecoin adoption, and they should be read separately from the dollar-pegged coins in this report.
USDC: the decline that hid in plain sight
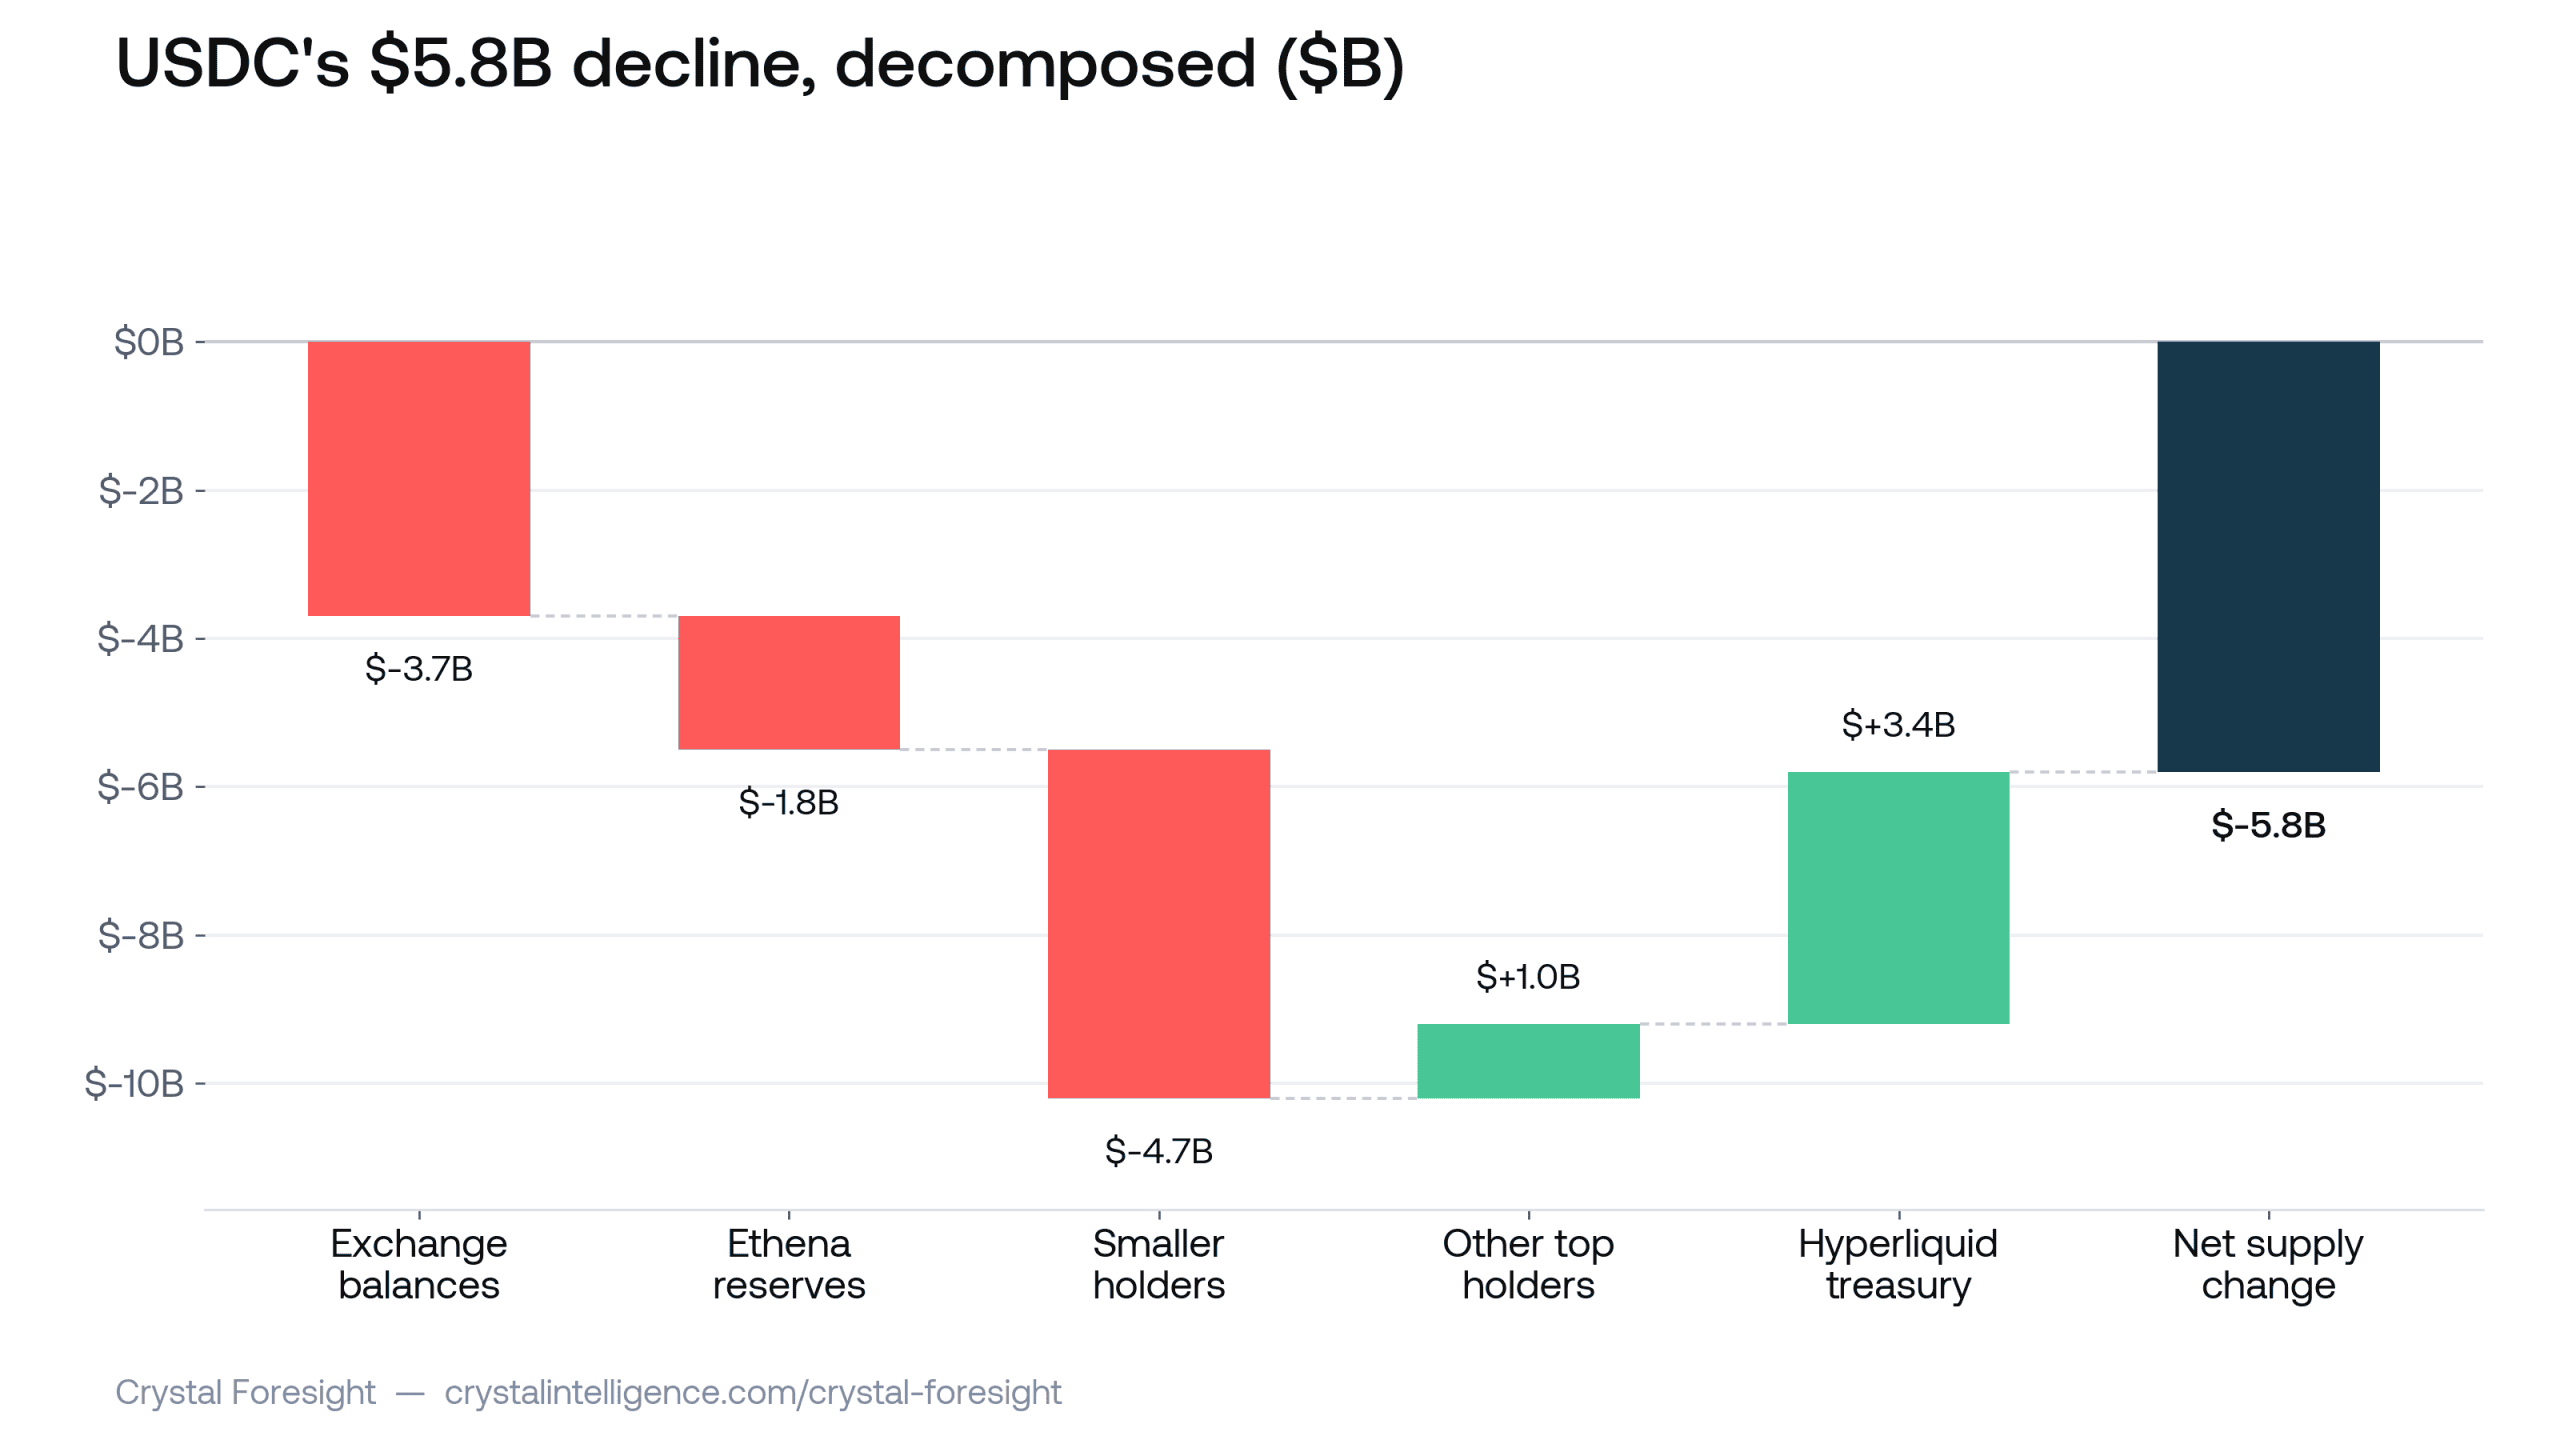
USDC did more of the shrinking than the next four decliners combined. Its fingerprint shows why it is so exposed: only about a tenth of its volume is organic, a payment, a transfer, a settlement, while 58% is collateral and another fifth is DEX liquidity. USDC is the working capital of DeFi, so it contracts when DeFi cools. Its gross transfer volume fell 46.5% week-on-week.
The holder data looks tame at first. The top 500 addresses holders fell just $1.5B against a $5.8B drop. But that hides a single distortion: a $4.9B inflow into Hyperliquid’s new USDC treasury, the Coinbase-deployed address that took Circle’s record ~$4B transfer in June as USDC went native on the exchange. That is USDC relocating, not fresh demand. Strip it out and the decline is plain: exchange balances down $7.1B, Ethena’s reserves down $2.0B as USDe unwound, and smaller holders down a further $4.3B. One consolidation was papering over a broad redemption.
The rest, briefly
USDe −$2.0B · −34%
Its yield stalled. Perpetual-futures funding turned negative-to-flat through the spring, sUSDe’s return compressed to the mid-single digits, and about $1.5B left the staking product, part of a broader rotation from crypto-native yield into tokenised-Treasury products like BUIDL and USDY.
USDS −$2.0B · −23%
Sky cut its Savings Rate from 6.5% to roughly 3.6%, so staked sUSDS unwound. USDS and DAI share one Sky reserve base, so read them together: the pair fell from about $13.2B to $11.5B, part of it simply savers stepping out of the yield wrapper and back into plain DAI.
USDT −$1.4B · −0.7%
Barely moved, and by strategy rather than yield. Tether stays outside both MiCA and the GENIUS Act rather than adapt USDT, routing regulated demand to separate products such as USAT. The small outflow is largely European venues being required to delist it: a deliberately capped coin, not a struggling one.
PYUSD −$1.2B · −31%
Its DeFi-lending base is incentive-sensitive capital, and it had reason to leave. A February OCC proposal cast doubt over issuer-linked yield programmes just as PayPal reorganised PYUSD into a payments-first unit in late April.
USDG +$829M · +40%
The fastest grower, and the growth was bought. The Global Dollar Network’s yield-sharing model bankrolled a roughly 7% lending programme on Robinhood’s new chain and seeded Solana lending pools, where most of the new supply landed. Durable only as long as the incentives are.
USD1, RLUSD, DAI grew on new rails
The other gainers grew on distribution. USD1 went live natively on the Tempo payments network. RLUSD added institutional milestones, including a cross-bank tokenised-Treasury settlement on the XRP Ledger with J.P. Morgan and Mastercard. DAI is the mirror of USDS within Sky.
What it adds up to
No single verdict explains this quarter, and that is the point. Two patterns matter for how the next quarter should be read. First, most of the decline traces to yield being cut, at Ethena and at Sky, not to confidence being lost. That mechanism can run in reverse: if on-chain yields recover or rates ease, the same coins could refill as quickly as they emptied. Second, USDC’s exposure to DeFi collateral cycles means it will keep moving with DeFi sentiment more than with stablecoin sentiment specifically.
What to watch: whether Ethena’s funding-rate trade turns positive again, whether Sky revisits its Savings Rate, and whether the OCC settles its stance on issuer-linked yield one way or the other for PYUSD. The yield and collateral fingerprints, not the headline supply number, are where the first sign of a turn will show up.
Frequently asked questions
Does this decline mean a stablecoin lost its peg?
No. Every coin discussed here was burned through normal redemption, not a de-peg. A shrinking supply means money left the chain for bank dollars. The price of each coin, not its supply, is what would signal a de-peg, and none did.
Why did gold-backed stablecoins fall along with dollar stablecoins?
For a different reason. PAXG and XAUt track the spot price of gold, not dollar redemption. Their supply moved with a broader pullback in the gold market, not with anything specific to stablecoins.
What is a “transfer fingerprint”?
It is Crystal Foresight’s classification of what each transfer is actually part of: collateral movement in a lending market, DEX liquidity, a yield deposit, exchange flow, or a plain payment. It shows what a coin is used for, not just how much of it moves.
Could this contraction reverse?
Some of it could. Much of the decline traces to yield programs being cut rather than demand disappearing. If Ethena’s funding trade turns positive again, or Sky raises its Savings Rate, some of that supply could return.
Why are USDS and DAI discussed together?
Both draw on the same Sky reserve base. Savers moving out of staked sUSDS and into plain DAI show up as a decline in one coin and a rise in the other, so reading either in isolation would miss the transfer between them.
Sources & notes
Supply and fingerprint figures are Crystal Intelligence on-chain data to 14 July 2026, cross-checked against DefiLlama (agreement within ~1% per coin; Gold price context drawn from public market reporting on the January 2026 record and subsequent pullback. Off-chain drivers drawn from public reporting: CoinDesk, Cointelegraph, crypto.news (Circle’s record ~$4B transfer, 12 June 2026), and issuer and protocol announcements. USDT/MiCA/GENIUS and USAT framing draws on public reporting and Tether disclosures.
This analysis is for informational purposes only and does not constitute financial or investment advice. On-chain supply and fingerprint figures are directional and reflect data available as of July 14, 2026. Entity and function attribution is derived from the balances and transfers of each coin’s largest holders and is a guide to where supply concentrated, not a full reconciliation of total supply. Off-chain drivers represent probable causes, not confirmed causation. Data: Crystal Intelligence, Dune and DefiLlama.