
Key takeaways
- Broad organic share instability. Eight assets posted organic share changes exceeding five percentage points week-over-week – swings in both directions . USDT led at 54.6%, processing $177.8B in authentic money movement from $325.8B gross volume.
- RLUSD challenges for quality leadership. With 53.1% organic share and 51.7% peer-to-peer counterparty activity from $2.8B gross volume, RLUSD demonstrated that payment authenticity can scale without DeFi dilution. Real usage remains strong despite a contracting market cap (-$83.$M) and falling gross volume – a quality over quantity signal.
- Supply-settlement disconnect persists.USDS expanded supply by $267.7M while generating only $554.8M in genuine money movement from $17.3B gross volume. That is a 3.2% organic share with zero peer-to-peer settlement activity.USDS is used primarily in conjunction with sUSDS by holders seeking yield, not as a payment instrument.
- Volume inflation remains structural. USDC processed $1.56T in gross volume but delivered only $114.9B (7.4%) in authentic transfers. Most of that gross figure consists of DEX liquidity mechanics, not payment settlement.
The week in context
The stablecoin market stood at $301B in total capitalization this week across 27 tracked assets. The central tension: gross transfer volume reached $1.96T, but only $508B – roughly 25.9% – represented genuine money movement rather than DeFi recycling and protocol mechanics.
Crystal Foresight measures this gap using two analytical lenses. Organic share captures the portion of transfer volume that represents real money movement between distinct parties – excluding DeFi collateral rotations, automated protocol operations, and issuer supply management. Net transfer volume strips out round-trip flows to show the actual dollar value changing hands. For a full breakdown of how these metrics are constructed, see our methodology analysis.
USDT maintained its position as the market’s settlement leader. It processed $325.8B in gross volume and delivered $177.8B in authentic usage – a 54.6% organic share, up 8.4 percentage points from the prior week. RLUSD told a different but equally important story: from just $2.8B in gross volume, it generated $1.49B in genuine movement with 53.1% organic share and strong peer-to-peer activity.
Net supply across the market contracted by $667M. Expansion was led by USDS at $267.7M, DAI at $59.4M, and USDTB at $50.5M. Contraction was driven by USDC at $747.9M, PYUSD at $125.8M, and RLUSD at $83.4M. Whether that contraction reflects demand cooling or quality concentration is the question that frames the rest of this report. For how last week’s data compared, see the prior edition.
Market overview
The table below shows the top assets by market cap along with the volume composition of their gross transfer volume, their organic share, and the dominant usage archetype.
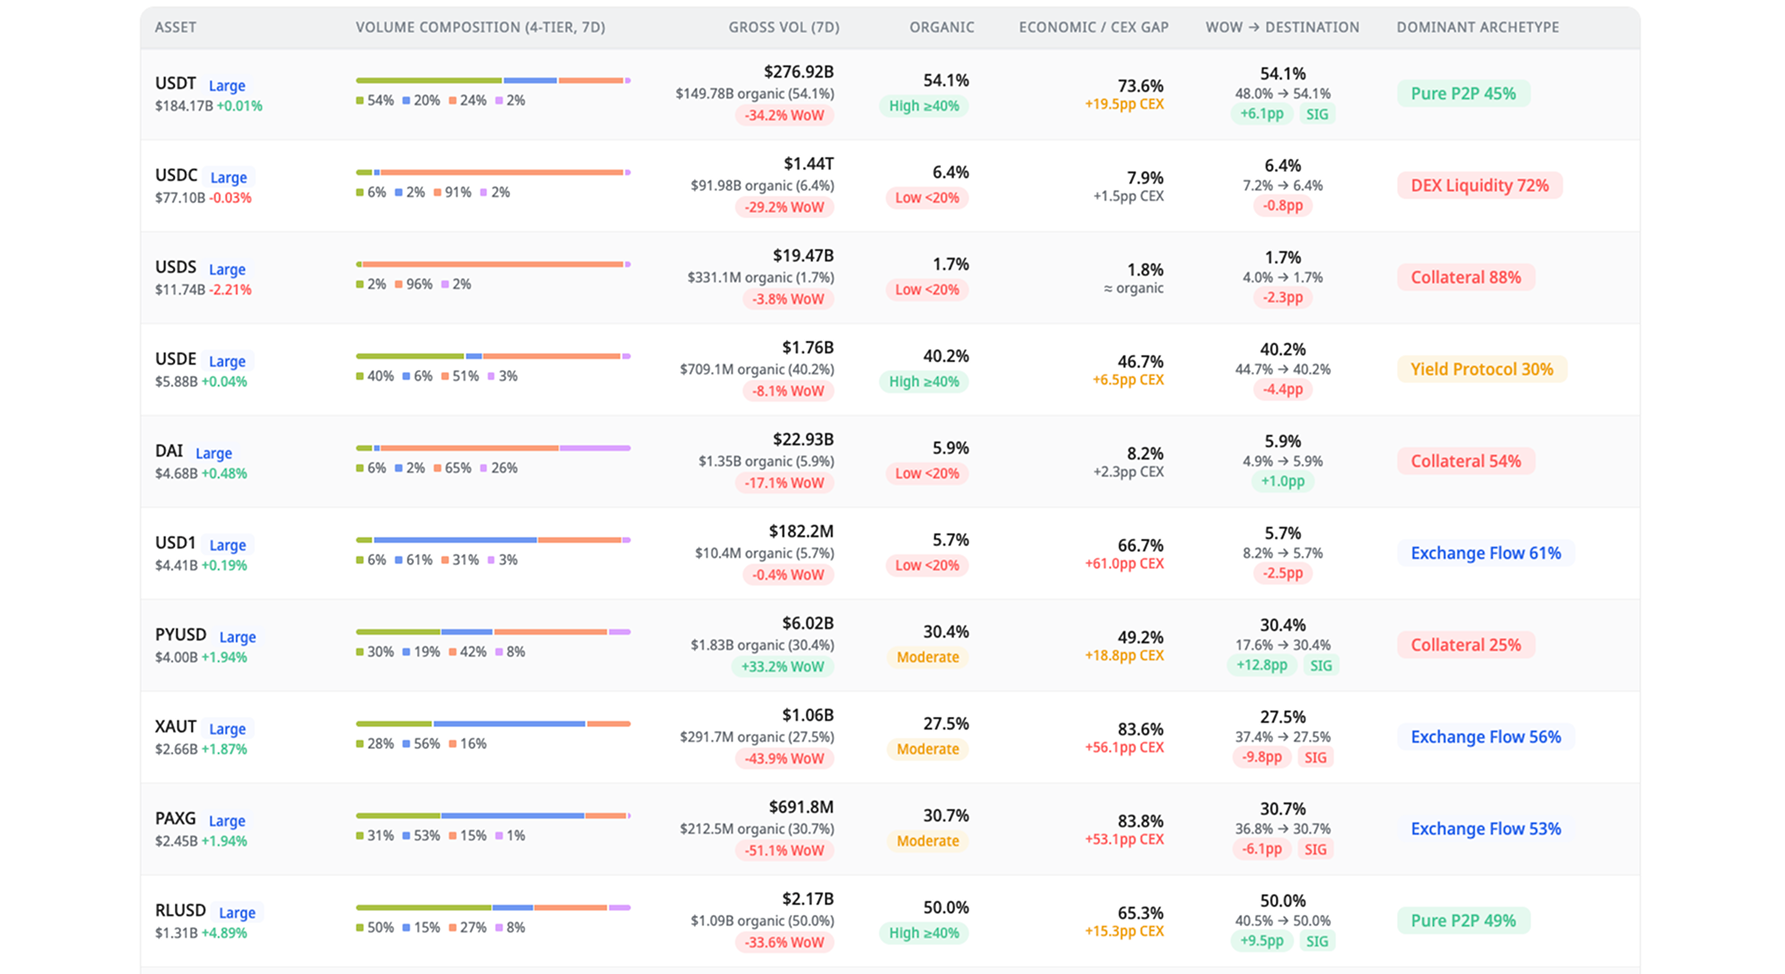
Three patterns stand out. First, USDT and RLUSD are the only large-cap assets posting week-over-week net transfer growth- and both carry organic share above 50%.
Second, USDS combined an $11.6B market cap with just $46.8M in daily net transfers and 94% top-10 concentration. That profile raises questions about who is actually using this asset beyond yield protocol mechanics. Third, gold-backed assets XAUT and PAXG both saw sharp transfer declines of 62.1% and 72.4%, respectively, reflecting a correction after elevated activity in prior weeks.
Organic share: where the instability appeared
Organic share strips out protocol mechanics to measure genuine money movement – transfers between distinct counterparties for settlement, payment, or real economic activity. For the full methodology, see our March 9 analysis.
This week, eight assets posted organic share improvements exceeding five percentage points. That is a notable reversal from prior weeks, when settlement quality had been declining across the market. But this is instability, not recovery, as the swings went in both directions
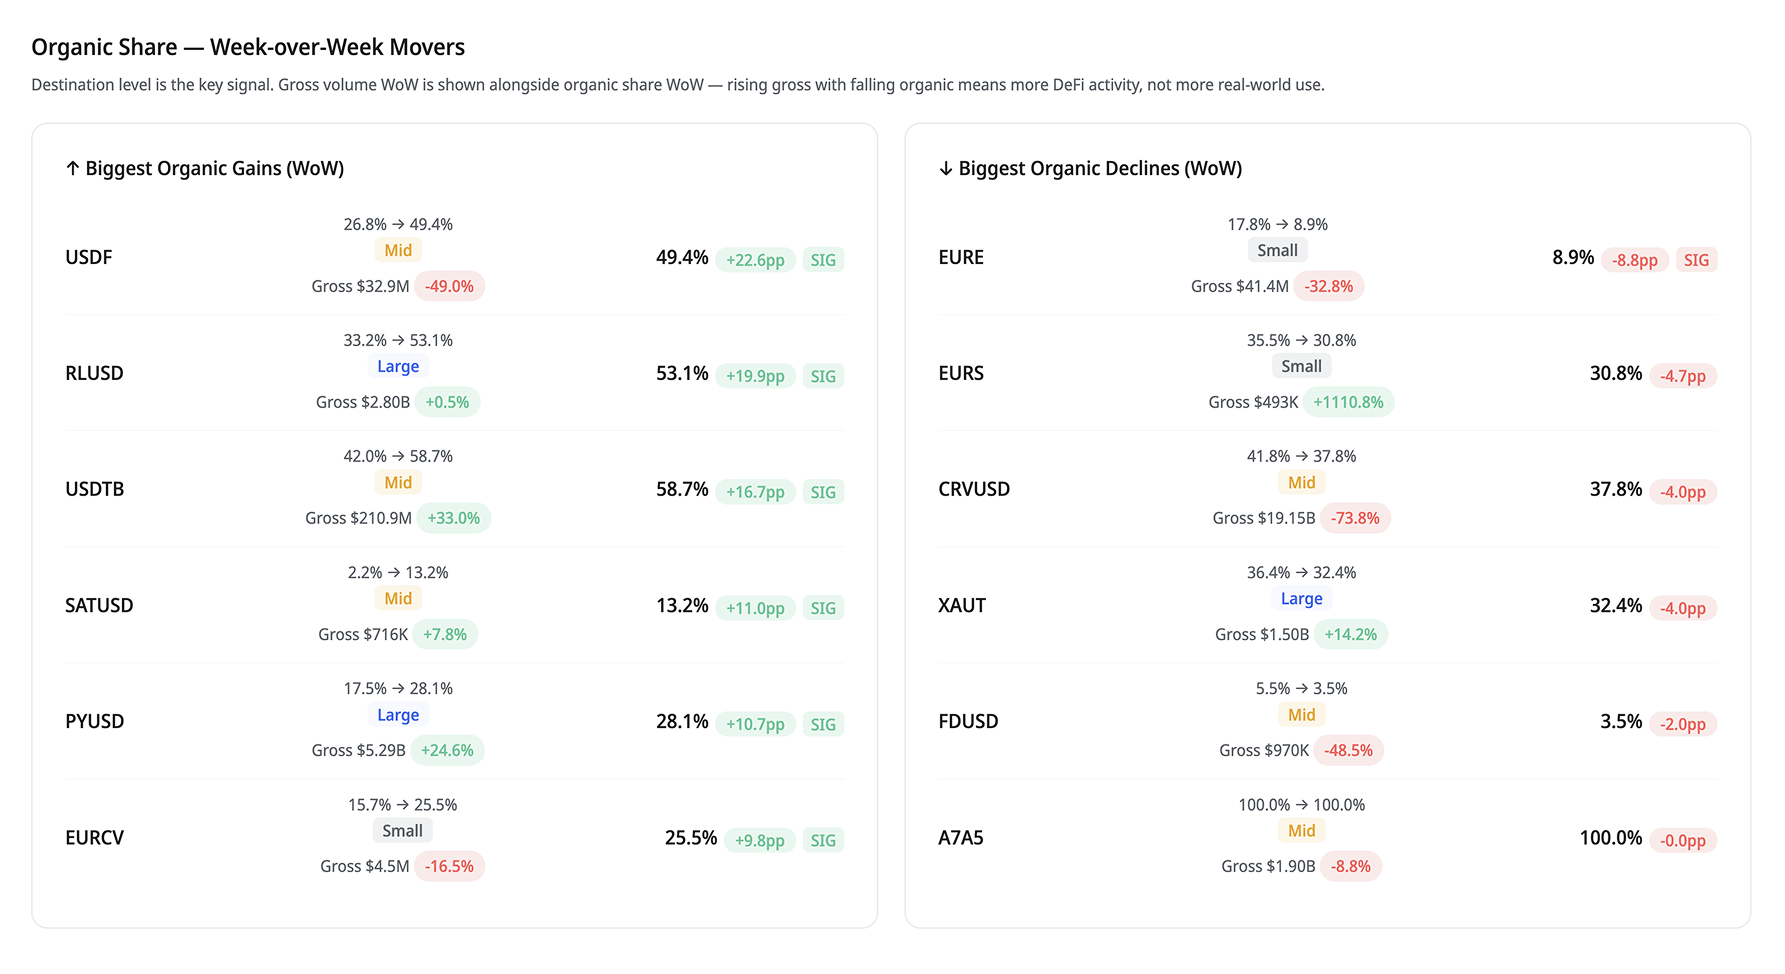
The biggest gains came from USDF (+22.6pp to 49.4%), RLUSD (+19.9pp to 53.1%), and USDTB (+16.7pp to 58.7%). USDT, the largest asset by far, improved by 8.4pp to 54.6% – proving that settlement quality can improve even at massive scale. PYUSD gained 10.7pp to 28.1%, while gross volume grew by 24.6%, breaking the typical pattern in which volume expansion dilutes organic share.
RLUSD’s improvement deserves close attention. Organic share rose 19.9 percentage points while market cap contracted by $83.4M, and gross volume fell. This means real usage remained strong even as the asset lost ground on other metrics. It is a quality-over-quantity signal – the kind of pattern that distinguishes a genuine payment instrument from one inflated by protocol mechanics.
At the bottom of the table, USDS remained at 3.2% organic share. Of its $17.3B in gross volume, 94.5% was financialized activity. USDS is used primarily in conjunction with sUSDS by holders seeking yield, not as a payment or settlement instrument. FDUSD sat at 3.5%, with most of its volume driven by exchange routing and DEX mechanics rather than direct settlement.
A7A5 – aruble-backed stablecoin -continued to hold 100% organic share with $1.9B in gross volume. However, this overall volume nets out to $496M in balance changing movement. This indicates the overall number represents movement back-and-forth between parties rather than actual position-changing volume.
Where quality and scale diverge
The chart below plots each asset’s organic share change (vertical axis: seven-day percentage-point movement) against its two-week market-cap change (horizontal axis). Bubble size represents market capitalization. Bubble color indicates the dominant flow type – green for pure peer-to-peer, salmon for DEX liquidity or collateral flow, blue for exchange flow, purple for issuance and redemption, and olive for real-world settlement.
The chart reveals four distinct quadrants. Upper-left: RLUSD improved organic share sharply (+19.9pp) while contracting market cap (-20%) – genuine usage strengthening as speculative supply exits. Upper-center: USDT and PYUSD both improved organic share while holding market cap roughly steady, the healthiest position for large-cap assets. Right-center: USDS expanded market cap (+10%) with near-zero organic share improvement – supply growing without settlement quality. Lower-left: XAUT lost organic share (-13pp) while contracting market cap, reflecting the precious metals correction.
The divergence between RLUSD and USDS is the chart’s clearest signal. One is losing market cap but gaining real usage. The other is gaining market cap without it. For institutional participants, this distinction matters more than headline capitalization.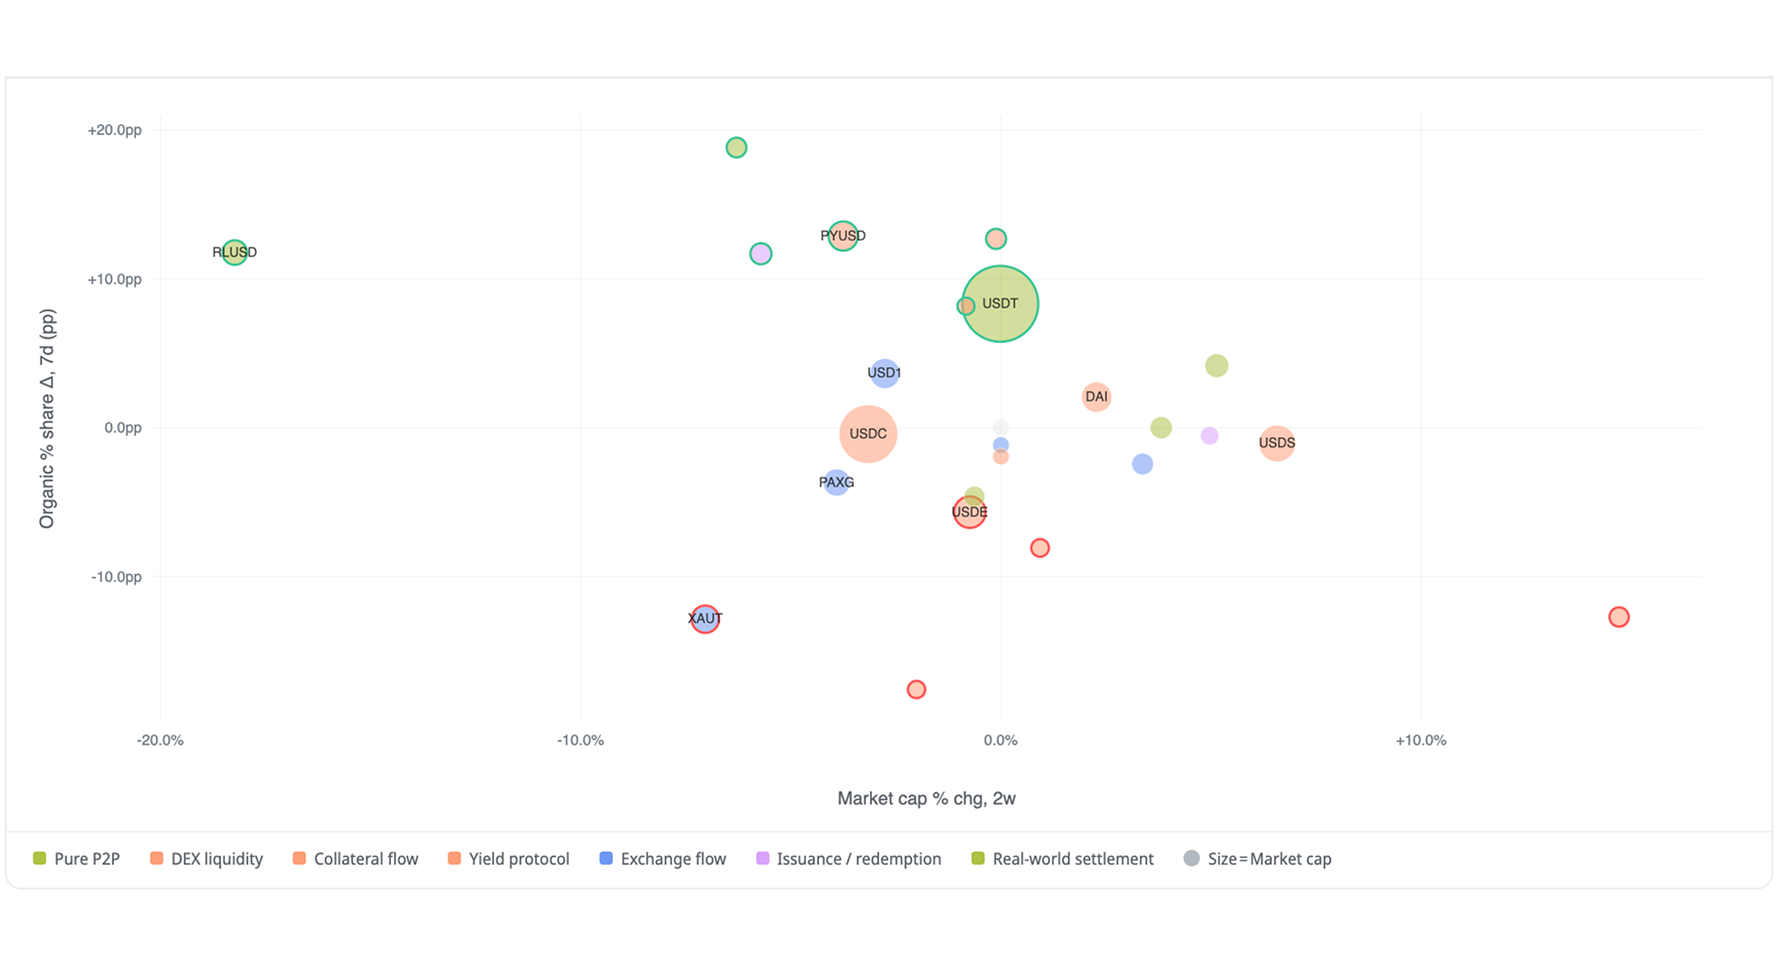
Two-week market cap change by asset
XAUT posted the largest two-week decline at 11.0%, followed by RLUSD at 9.2% and USDF at 8.0%. On the expansion side, FDUSD grew 6.1%, and USDTB grew 5.7%. USDS expanded 3.2% on a two-week basis, continuing its pattern of supply growth that is not matched by settlement activity.
Over a 90-day window, the picture shifts. PAXG gained 44.0%, driven by gold price appreciation. USD1 grew 31.6%. USDS expanded 24.4%. On the contraction side, USDAI dropped 52.5%, EURS lost 57.8%, and EURA declined 87.3%.
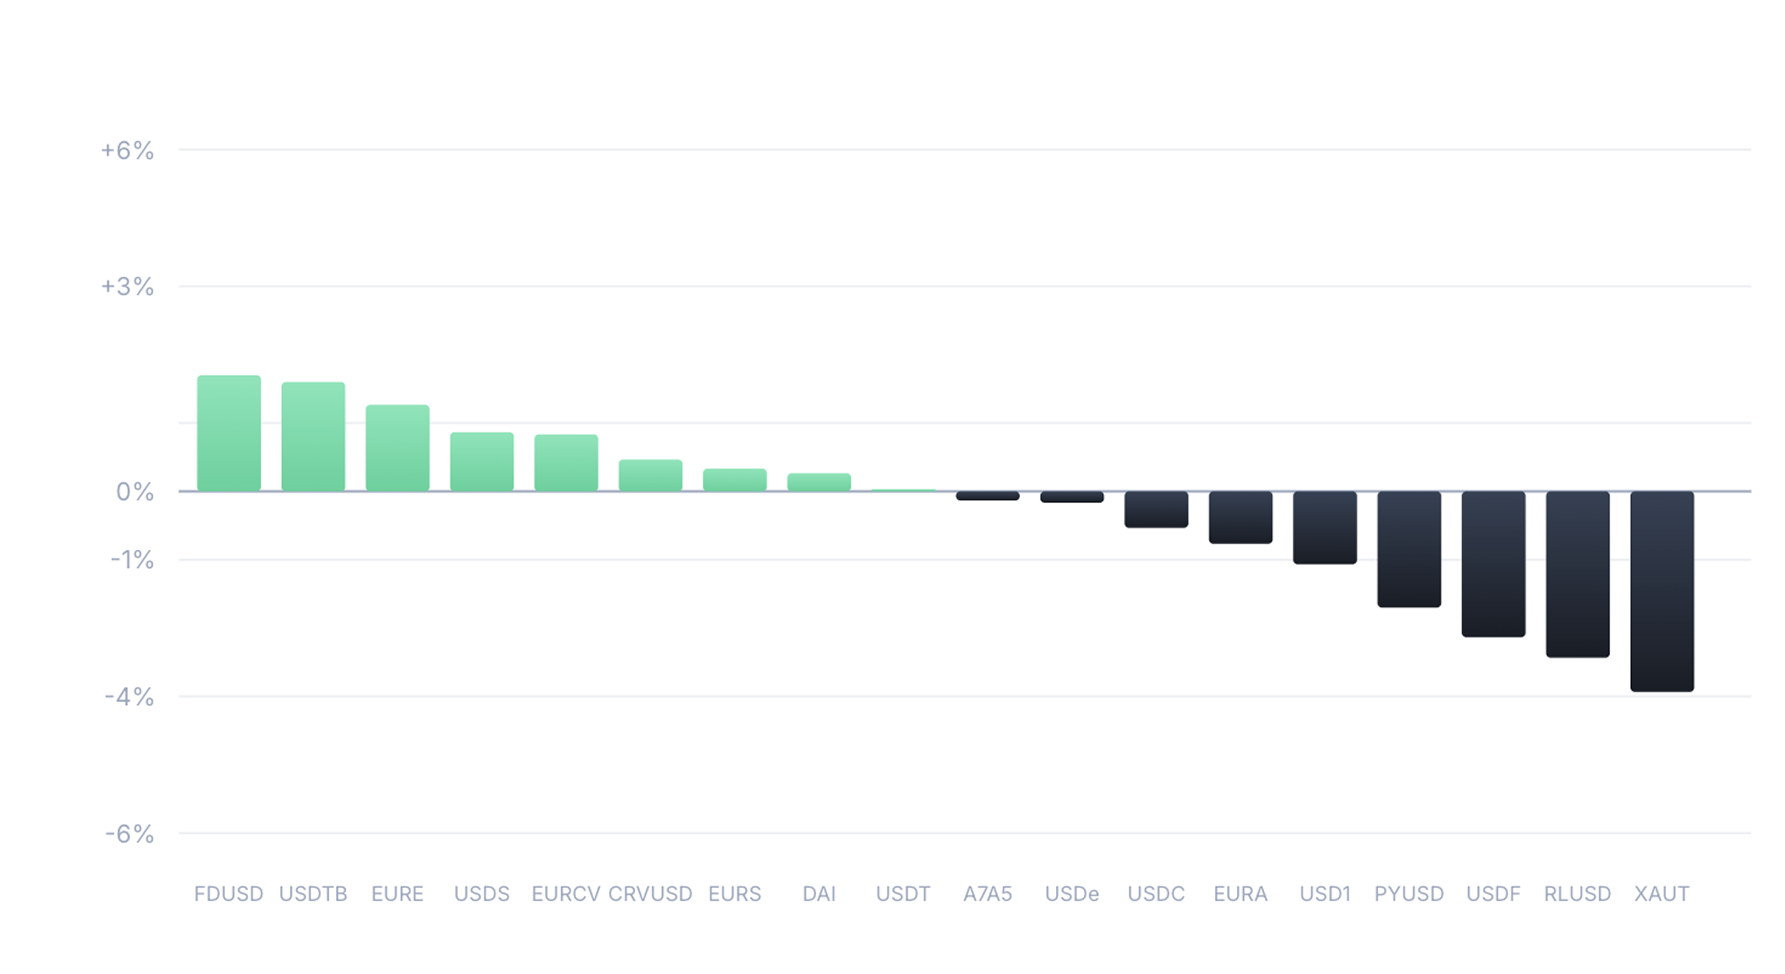
Source: Crystal Foresight. Market cap percentage change over two weeks by asset. Positive bars (teal) indicate supply expansion, negative bars (dark) indicate contraction.
Supply dynamics: net contraction of $667M
The market recorded $463.8M in net expansion and $1.13B in net contraction, producing a net supply reduction of $667M.
Expansion: $463.8M across four assets
USDS added $267.7M but maintained just 3.2% organic share and zero peer-to-peer settlement. This is the core accountability question: who is absorbing this new supply, and for what purpose? The data points to lending protocol collateral mechanics, not payment demand- this asset functions as a yield instrument via sUSDS, not as settlement infrastructure. DAI expanded $59.4M with healthier protocol utility. USDTB added $50.5M while simultaneously improving organic share by 16.7 percentage points to 58.7%, suggesting genuine demand growth.
Contraction: $1.13B across eight assets
USDC contracted by $747.9M, the largest single-asset reduction. This coincided with a 20.2% decline in net transfer volume, suggesting reduced DeFi activity rather than a shift in payment demand. PYUSD contracted $125.8M while improving organic share by 10.7pp – a pattern consistent with volume concentrating toward genuine usage as speculative or protocol-driven activity exits. RLUSD contracted $83.4M but posted the strongest net transfer growth at +33.6%, indicating that the supply reduction has not impaired settlement utility.
Risks worth examining
Supply-settlement disconnect. USDS expanded supply by $267.7M while maintaining 3.2% organic share and zero peer-to-peer settlement. Of $17.3B in gross volume, only $554.8M represented genuine money movement. An institutional holder evaluating USDS exposure should understand that this asset is used primarily in tandem with sUSDS for yield generation purposes rather than as a payment utility.
Volume inflation. USDC processed $1.56T in gross volume but delivered only $114.9B in authentic money movement, with 62.9% of volume representing DEX mechanics. USD1 and FDUSD show similar patterns. Headline volume figures create a false impression of adoption when the underlying settlement activity is minimal.
Concentration risk. USDS, USDe, USD1, USDTB, and A7A5 all carry top-10 holder concentration above 90%. At USDS 94.0% and USDe 95.8%, this means a small number of addresses control the vast majority of supply. Any rebalancing by these holders could produce outsized market effects.
What to watch next week
Three patterns merit close attention.
- Will the broad organic share instability resolve into sustained improvement, or was this a one-week anomaly driven by temporary flow shifts?
- Can RLUSD maintain its trajectory above 50% organic share as market cap contracts – or does that quality signal attract new demand?
- And will USDS supply expansion develop any use case diversity, or does the asset remain as a single-purpose yield instrument?