Key takeaways
- USDC is functioning as a financial instrument, not as money. Organic share fell 11.7 percentage points to 18.6%, with 77% of all activity serving protocol uses – DeFi loan collateral, DEX swaps, and use loop activity. Collateral alone accounts for 50.6%. Only 6.4% of USDC volume represents genuine peer-to-peer transfers, despite a $78.6B market cap.
- USDT remains the market’s primary payment instrument. At $184.1B, it maintained 34.3% pure peer-to-peer activity and 33.9% settlement share – figures that hold despite its scale. No other large-cap asset comes close on both metrics simultaneously.
- Not all organic share is equal. CRVUSD achieved an organic share of 42.8%, almost entirely through real-world settlement, with just 0.8% routed through exchanges. XAUT gained 9.5 percentage points to 36.8% organic share, but 44.0% of its total volume routes through exchanges, and only 4.8% represents real-world settlement. The composition matters as much as the headline figure.
- Supply growth and genuine usage are moving in opposite directions. USDS added $613M in supply this week while recording 3.0% organic share and zero peer-to-peer settlement activity. At a $11.6B market cap, USDS is growing in scale without genuine payment adoption. That divergence is the defining pattern of this week’s market.
Market snapshot
The stablecoin market stood at $283.9B across 23 tracked assets this week, with an average organic share at 25.4%. Organic share measures the portion of transfer volume representing genuine peer-to-peer payments and real-world settlement, as opposed to DeFi collateral posting, exchange routing, or issuer supply operations. Net transfer volume captures only balance-changing activity, stripping out internal reshuffling. For a full breakdown of how these metrics are constructed, see our March 9 analysis.
USDT accounted for $184.1B in market cap with $5.38B in daily net transfers, a 7.1% week-on-week gain. USDC, at $78.6B, saw net transfers decline 20.2% to $1.45B – a contraction that coincided with its organic share falling 11.7 percentage points to 18.6%. At the other end of the scale, USDF posted a +338% transfer acceleration from a small base ($2.36M current versus $539K prior-week average), driven by genuine peer-to-peer payments rather than protocol activity.
Settlement quality: what the volumes actually represent
Headline transfer volumes describe scale. They do not describe quality. This section breaks down what stablecoin volumes actually consist of – whether transfers represent genuine payments between counterparties, exchange deposits and withdrawals, DeFi collateral operations, or issuer supply management.
The table below shows large-cap assets ranked by market cap, with volume composition, settlement share, and the dominant use case for each asset.
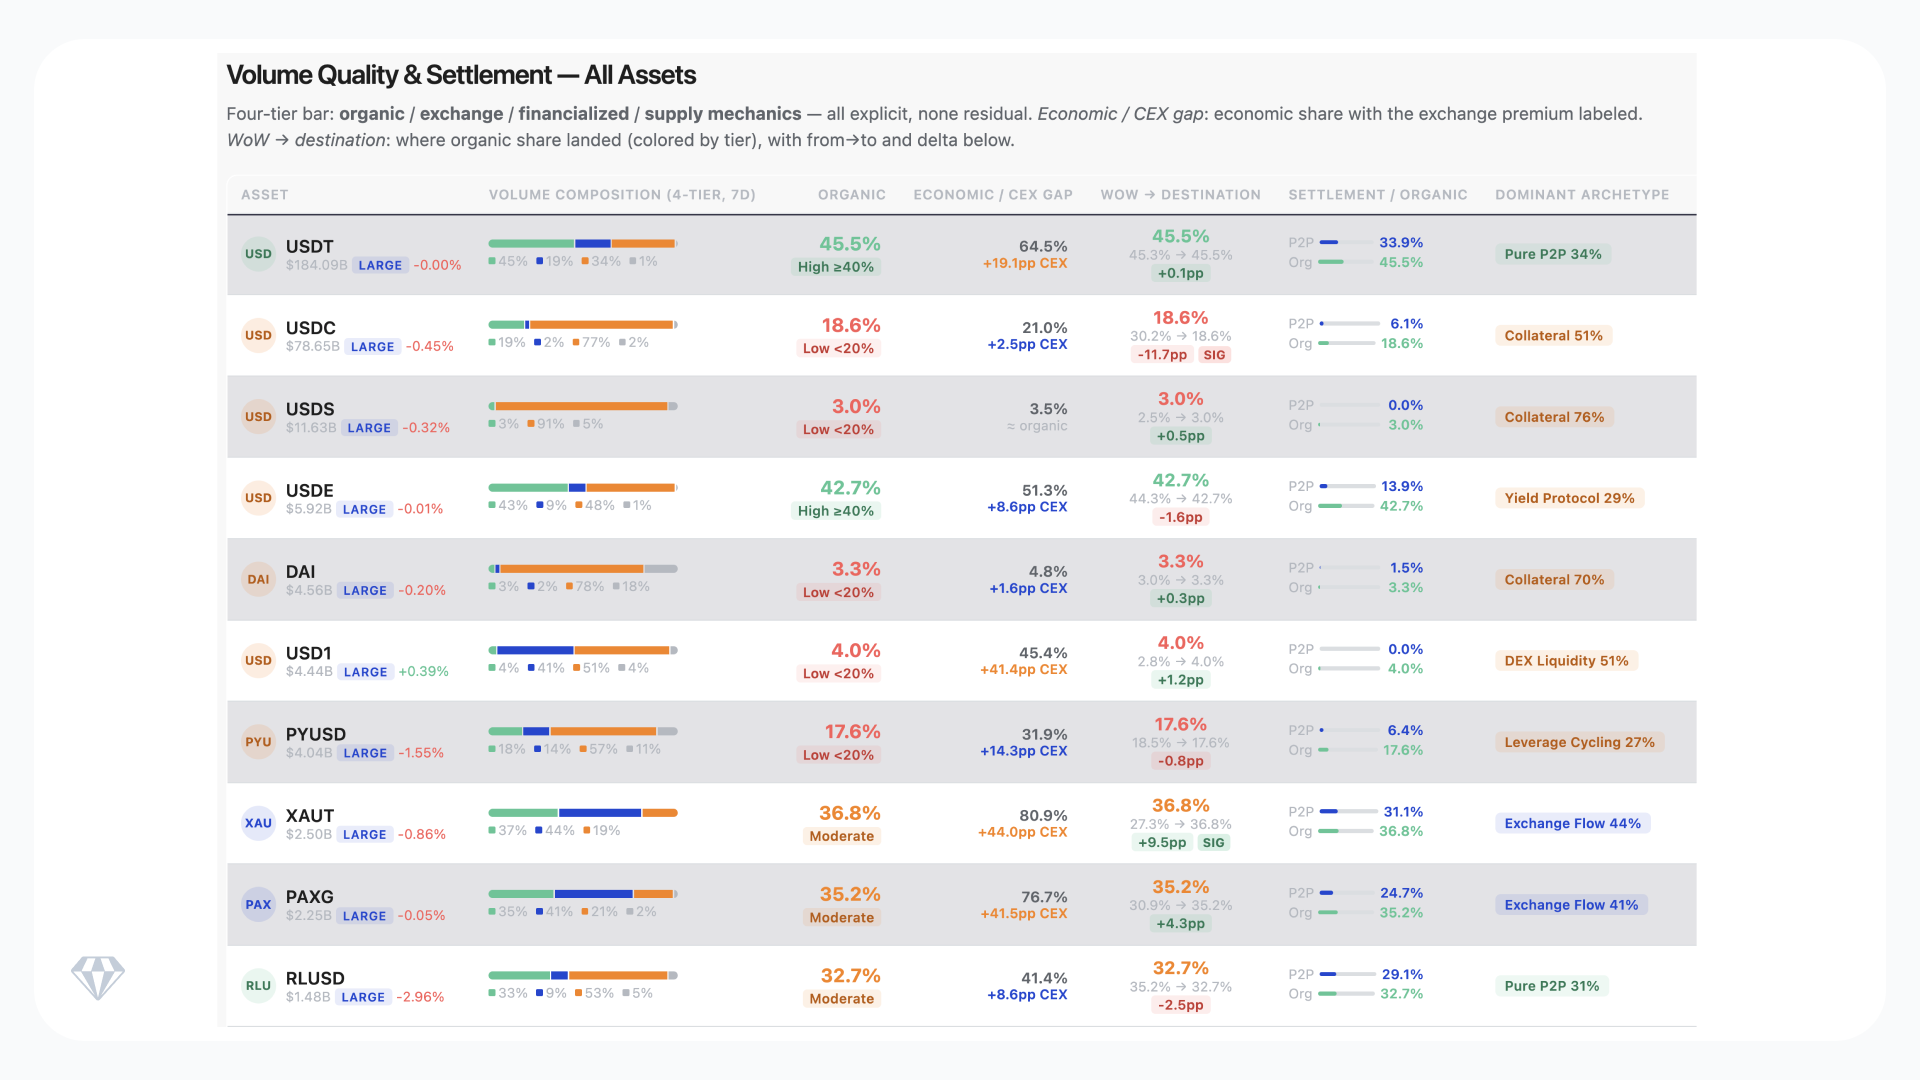
USDC’s organic share fell 11.7 percentage points to 18.6%, with 77% of all activity now serving protocol uses – DeFi loan collateral, DEX swaps, and use loop activity. Only 6.4% represents genuine peer-to-peer payments. For an asset with a $78.6B market cap, this raises a direct question: is USDC functioning as money or as DeFi infrastructure?
USDS and DAI occupy the bottom of the table with organic shares of 3.0% and 3.3%, respectively. USDS added $613M in supply this week while recording zero peer-to-peer settlement activity, with 76.4% of its volume in DeFi collateral operations. At $11.6B in market cap, supply is expanding while genuine usage is not.
XAUT gained 9.5 percentage points in organic share to 36.8%. But the composition tells a more complex story. Exchange flow accounts for 44.0% of total volume, while real-world settlement stands at just 4.8%. The organic share figure and the settlement figure tell different stories about how XAUT is actually being used.
An asset’s organic percentage is necessary but not sufficient. Settlement component analysis – separating peer-to-peer, exchange-routed, and collateral activity – provides the clarity that headline metrics obscure.
Two-week market cap changes
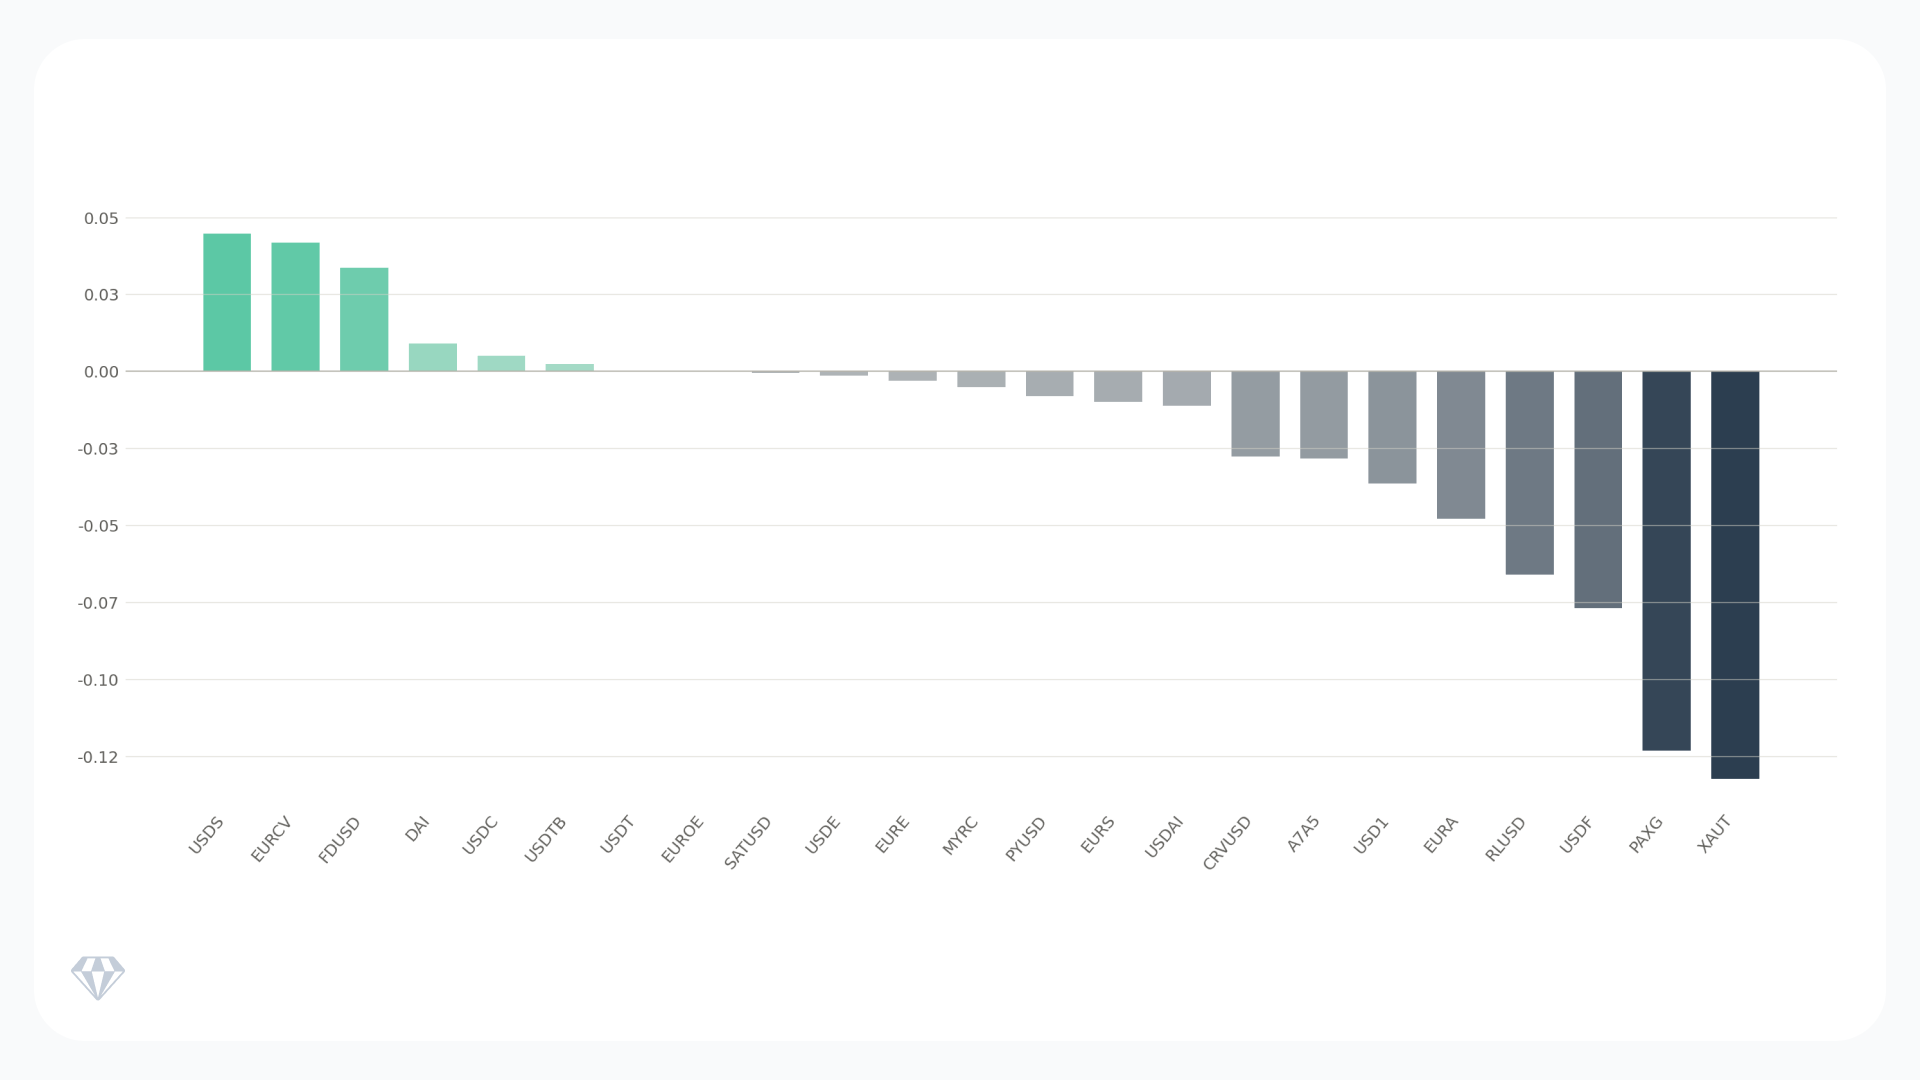
Source: Crystal Foresight. Market cap percentage change over two-week period ending March 24, 2026.
Over the past two weeks, supply-side expansion concentrated in three assets: USDS (+4.5%), EURCV (+4.2%), and FDUSD (+3.4%). USDS growth is notable given its 3.0% organic share. This is supply expanding without a corresponding increase in genuine payment activity.
On the contraction side, XAUT (-13.2%) and PAXG (-12.3%) posted the largest declines. Both gold-backed assets tracked a sharp correction in precious metals markets, where gold fell from above $5,000 to approximately $4,300-$4,400 per ounce over the period. The correction was driven by the Federal Reserve’s hawkish hold and dollar strengthening, which overrode the safe-haven bid despite the ongoing Middle East conflict. RLUSD fell 6.6%, and USDF dropped 7.7%.
Over 90 days, USD1 expanded 58.7%, which is significant growth for a $4.4B asset with 4.0% organic share and zero peer-to-peer settlement activity. USDS gained 20.3% of the same period, consistent with its protocol-driven supply pattern.
Among declining assets, FDUSD contracted 25.6% over three months, CRVUSD fell 28.9%. EURA dropped 87.3%, though its absolute base remains small at $3.3M market cap.
Over 365 days, PYUSD stands out at +378% annual growth, and CRVUSD at +193%, both from small bases. USDT grew 27.6% and USDC 31.7% on the two largest market caps in the tracked set. FDUSD declined 82.5% year-on-yearfrom its earlier peak.
Velocity and momentum signals
Net velocity measures how a stablecoin’s supply circulates – the ration so daily transfer volume to total market cap. High velocity paired with high organic share indicates genuine payment activity. High velocity paired with low organic share indicates protocol mechanics or exchange routing driving turnover rather than real-world usage.
USDT maintained 2.45% net velocity with 33.9% settlement share. At $184.1B market cap, that combination indicates active circulation at scale. EURE posted 3.92% velocity with meaningful settlement activity, the highest velocity among assets with genuine payment usage.
At the other end, USD1 shows 0.68% NET velocity with just 4.0% organic share despite a $4.4B market cap. USDS maintains 0.07% velocity with virtually zero settlement. Both assets show large market caps with limited genuine circulation – supply that exists but does not move for payment purposes.
Among accelerating assets, USDF led at +338% week-on-week with 18.6% peer-to-peer usage and 13.6% real-world settlement. EURS gained +253% from a small base ($44K current versus $13K prior). RLUSD accelerated 33.6% to $49.8M with 29.1% peer-to-peer activity, though 30.2% leverage cycling indicates mixed usage patterns.
Among declining assets, USDS fell 81.9% ($46.7M from $258M), CRVUSD dropped 79.8%, and PAXG declined 72.4%. CRVUSD’s decline accompanied a 6.0 percentage point organic improvement – suggesting a shift from speculative to genuine settlement usage despite lower absolute volumes.
Risks to monitor
Organic share deterioration in major assets. USDC’s 11.7 percentage-point decline suggests a potential structural shift in how the asset is used. If DeFi collateral demand continues to dominate across major assets, the distinction between stablecoins as money and stablecoins as protocol infrastructure becomes permanent rather than cyclical.
Settlement concentration risk. Genuine peer-to-peer settlement activity is concentrating on fewer assets. USDT carries a disproportionate share of authentic payment utility at scale. For compliance teams and institutional participants, an asset’s organic percentage is necessary but not sufficient – settlement component analysis separating peer-to-peer, exchange-routed, and collateral activity provides the clarity that headline metrics obscure. If market participants assume payment functionality based on market cap alone – treating USDS at $11.6B or USD1 at $4.4B as payment instruments – they miscalculate the actual settlement capacity of the market.
Supply-activity divergence. USDS expanded supply by $613M while net transfers collapsed 81.9%. Growing supply alongside falling activity creates a divergence that raises a direct question: Is new supply finding users, or is it accumulating without corresponding demand? This pattern will be tracked in subsequent editions.
What to watch next week
Three patterns merit close attention. Will USDS’s organic share stabilize or continue declining as DeFi collateral usage expands? Does USDS supply growth begin to correspond with transfer activity, or will the divergence widen further? And can assets like CRVUSD and RLUSD (both showing genuine settlement improvement this week) sustain that trajectory at higher volumes?
Crystal Foresight provides institutional-grade stablecoin market intelligence, covering 99% of the stablecoin market. Access real-time organic share data, settlement component analysis, supply dynamics, and cross-chain flow monitoring to make informed decisions about the assets you hold, accept, or depend on.